2024 DC School Ratings

The Office of the State Superintendent of Education (OSSE) recently released the 2024 school ratings for DC public schools. I was going to let it go, but then people started asking interesting questions. But let’s start from the beginning.

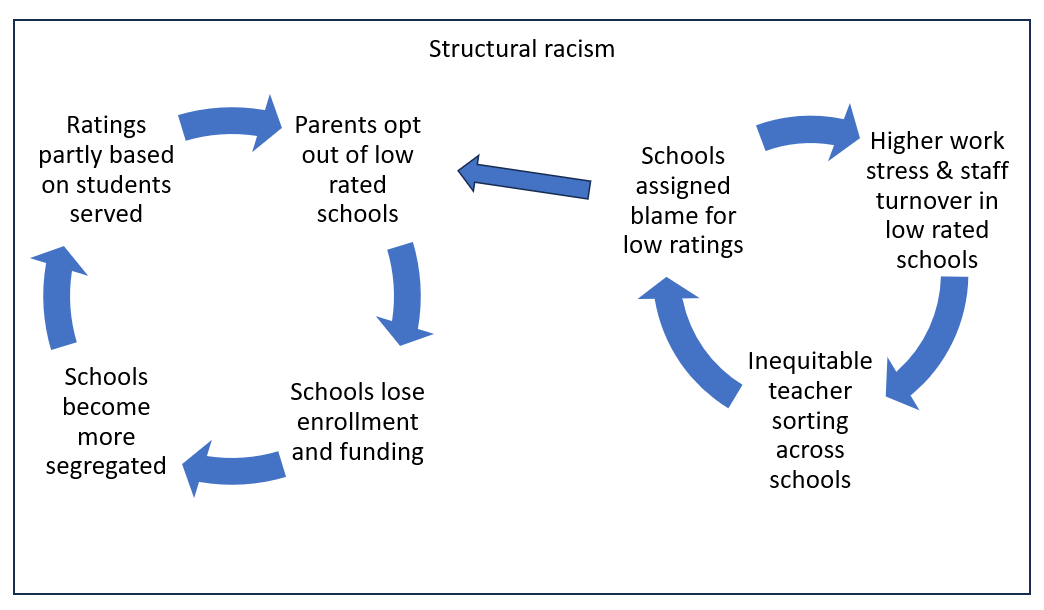
OSSE – and most state educational agencies across the country – rank schools at least partly based on who attends the school. Given the vast income inequality in the US, students experience very different opportunities to learn, resulting in large differences in test scores. And because school ratings are largely based on test scores, schools serving students from families with lower incomes are disproportionately assigned low ratings and considered to be “failing” schools, which leads to further disinvestment for the schools.
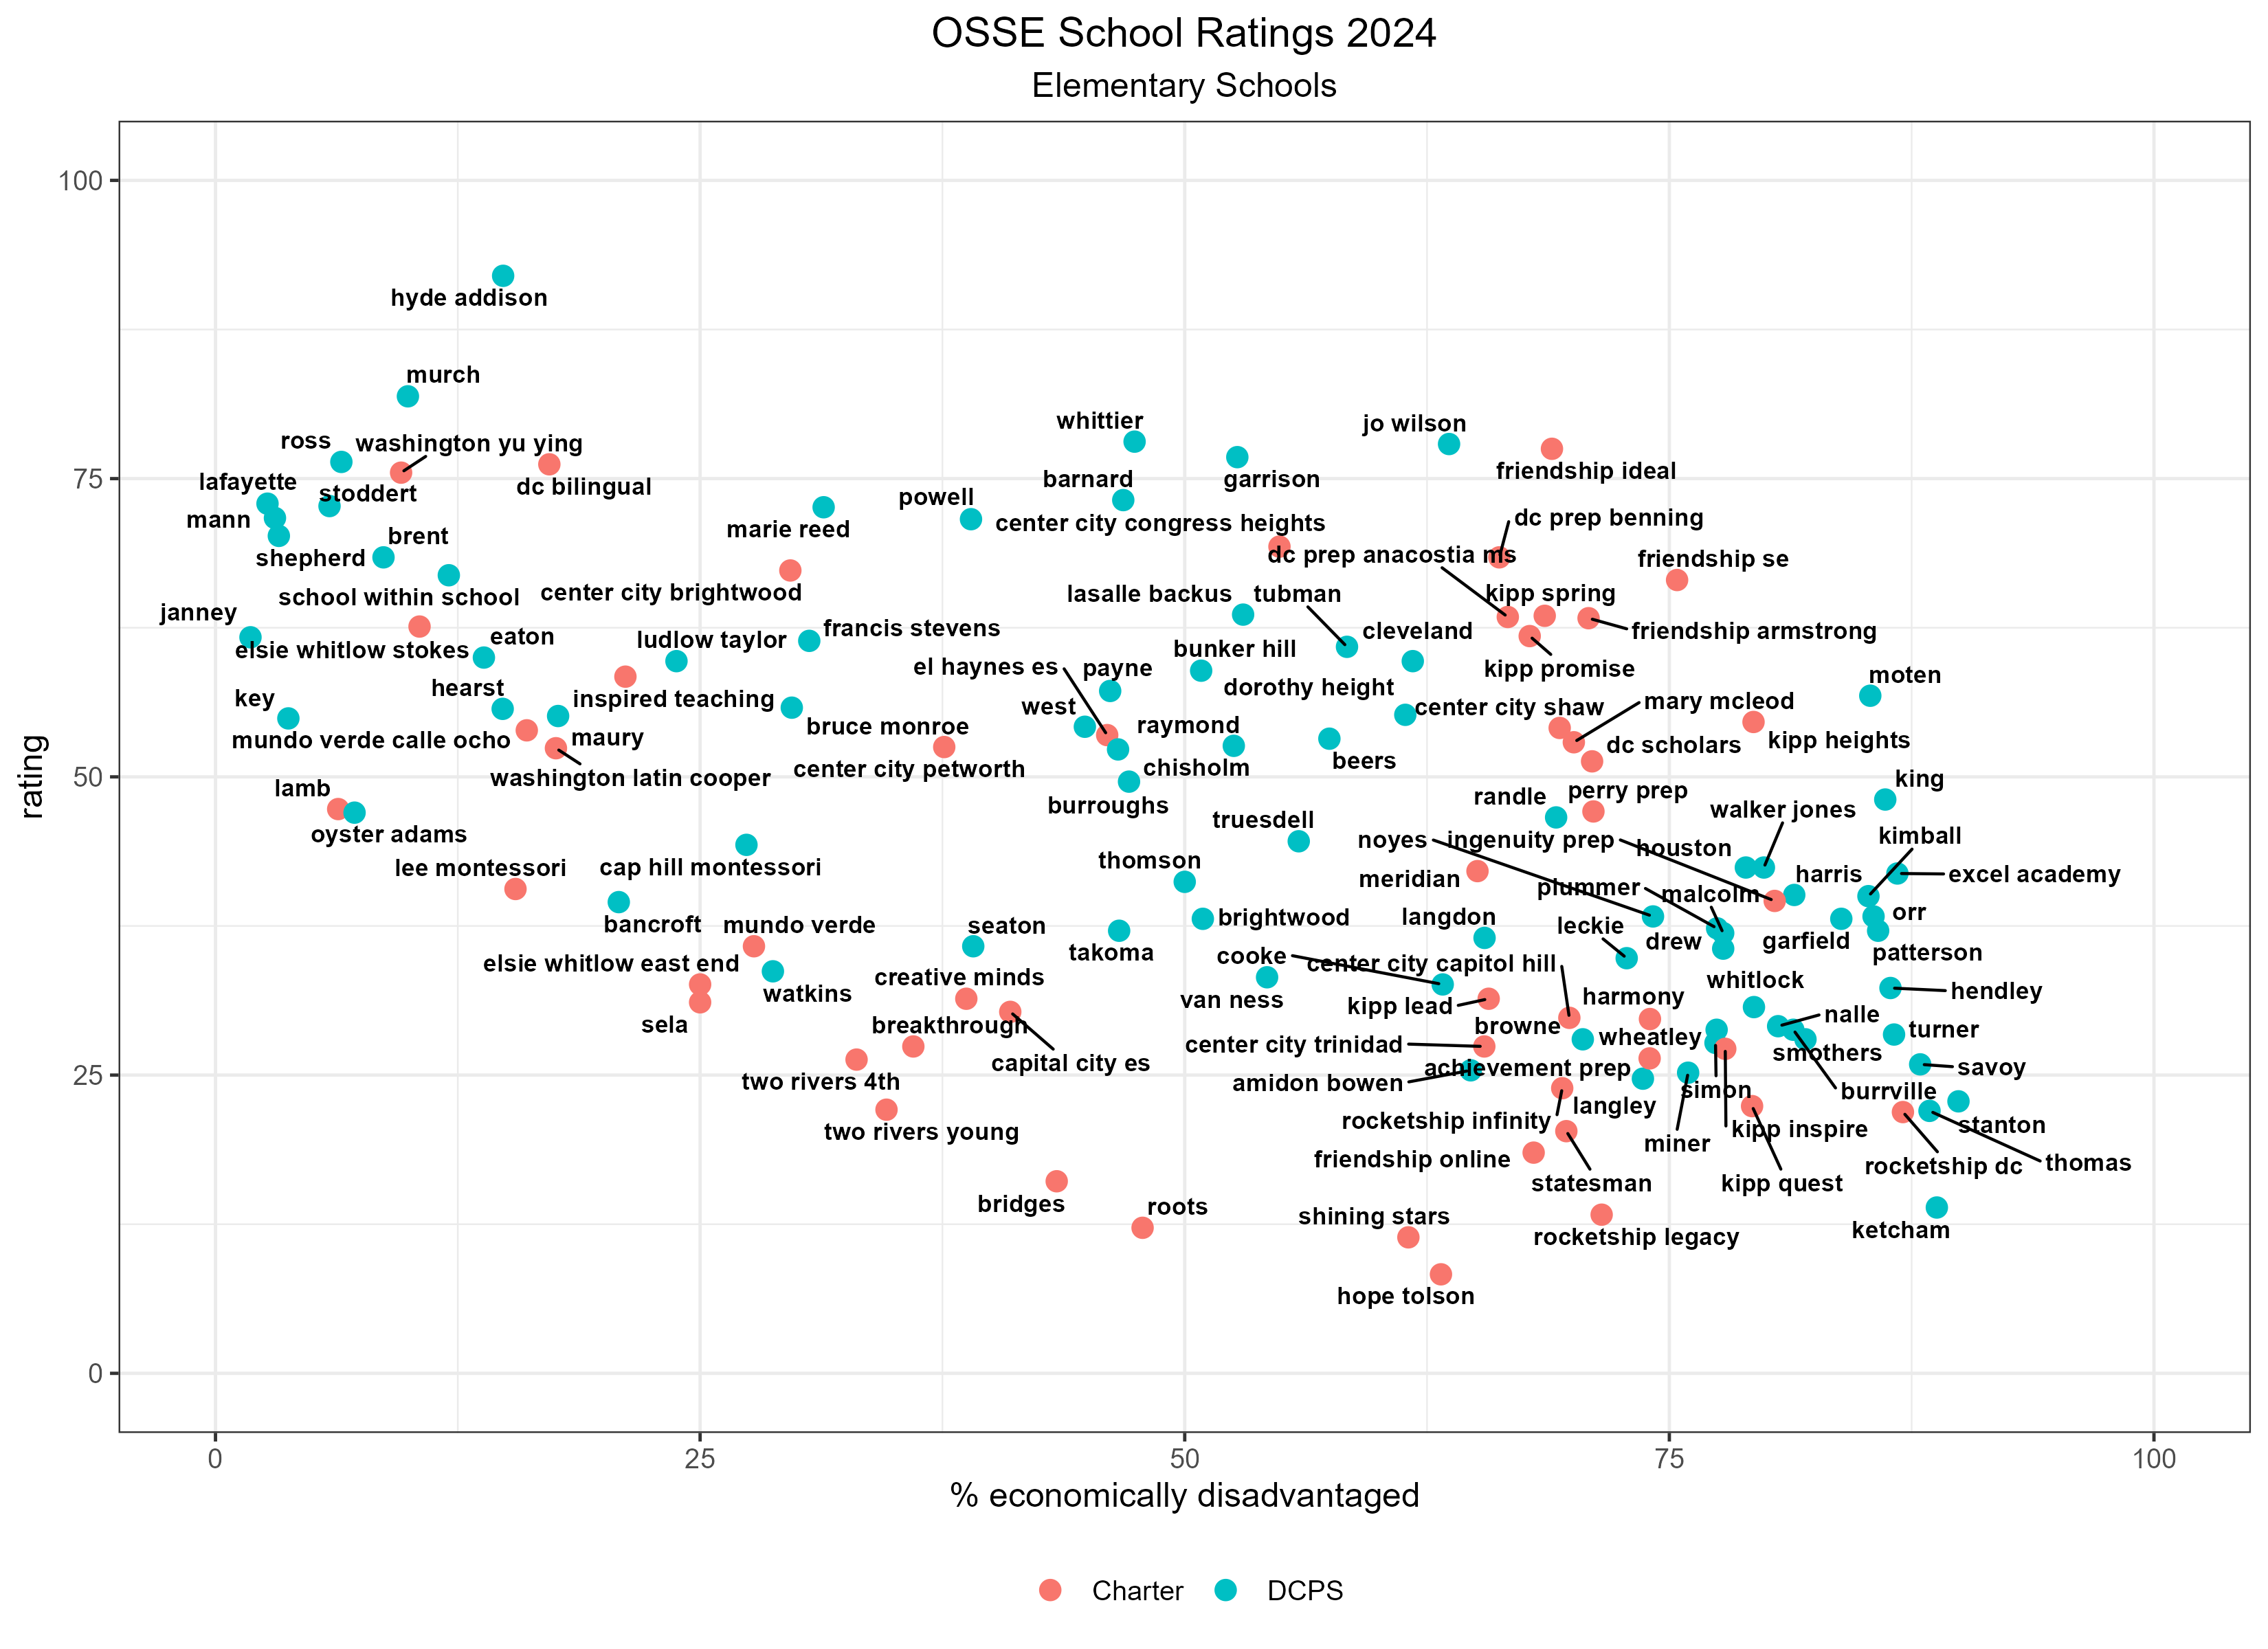
In the last few years, OSSE made changes to how it calculated the school ratings to make them more equitable. But the ratings are still not equitable. Here’s the relationship between student economic disadvantage and lower school ratings in 2024.
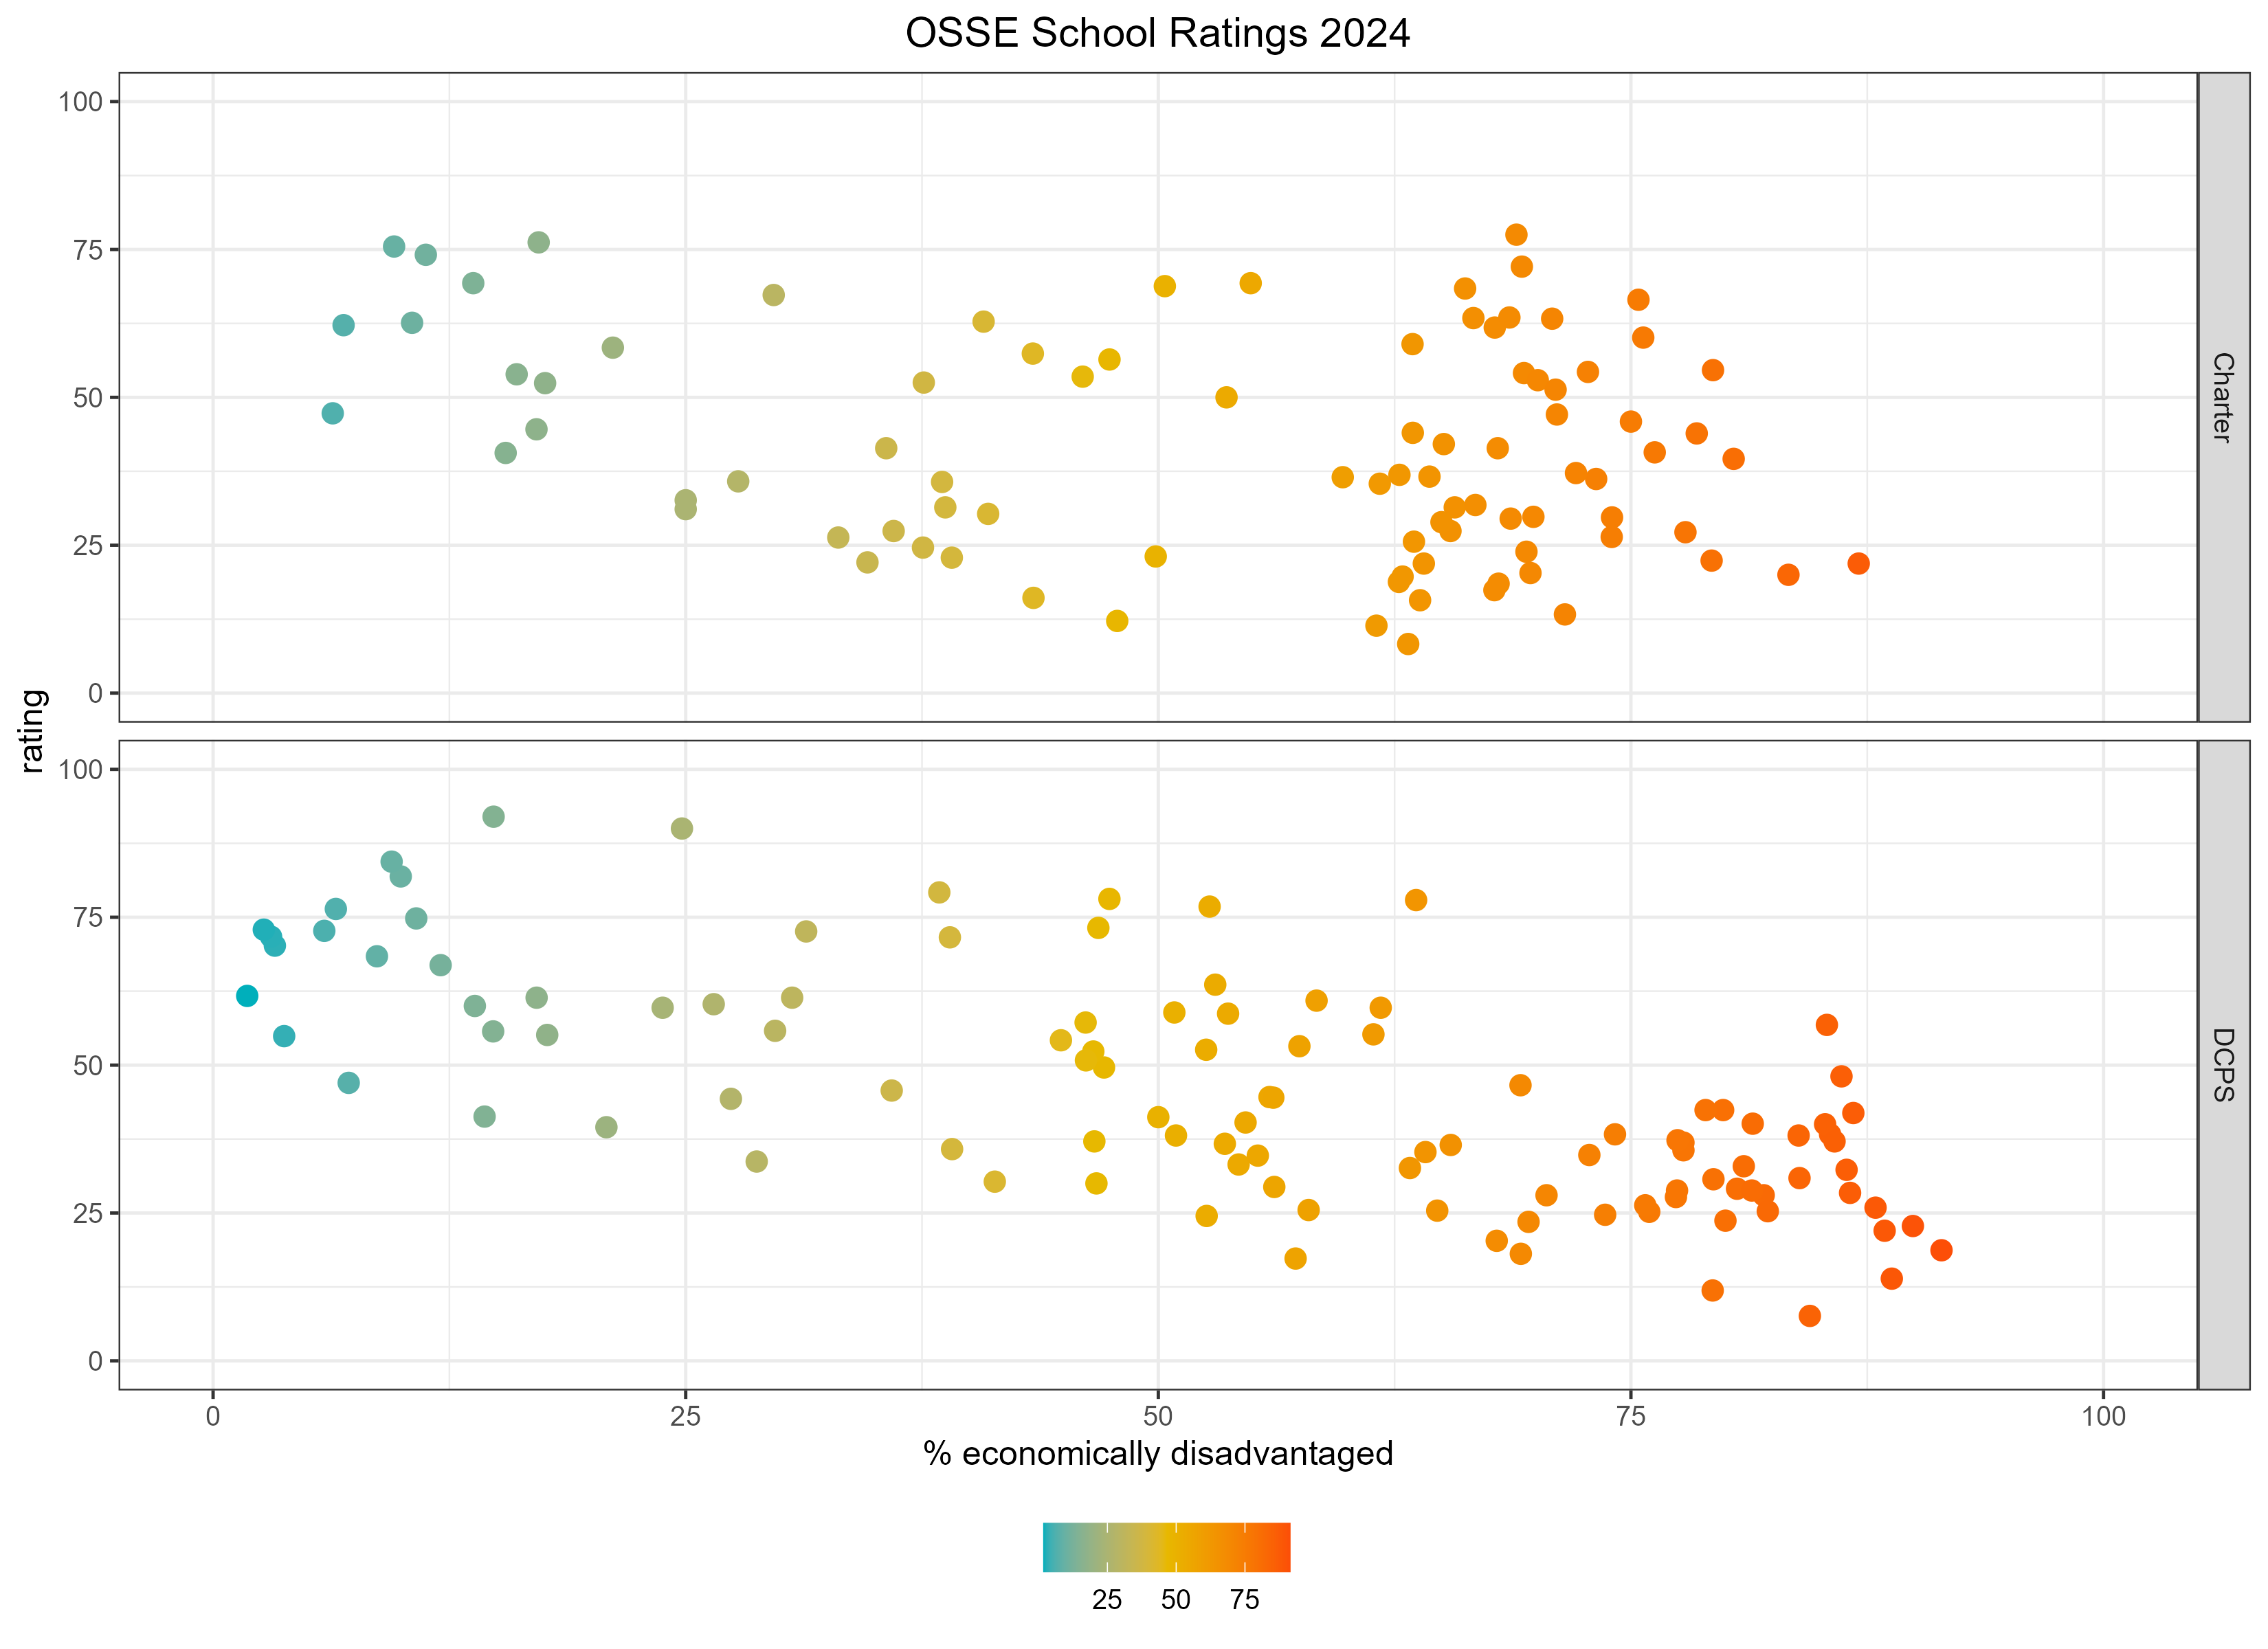
So how much of the school ratings are explained by student characteristics?
Student characteristics explain 29% of the variation in the 2024 ratings for elementary schools, 39% for middle schools, and 73% for high schools.[1] This means that a good chunk of the school rating is attributable to WHO the school serves as opposed to WHAT the school does. The remaining 30-70% is explained by some combination of a) the school’s actual contribution to student learning, and b) noise, which is like random error.
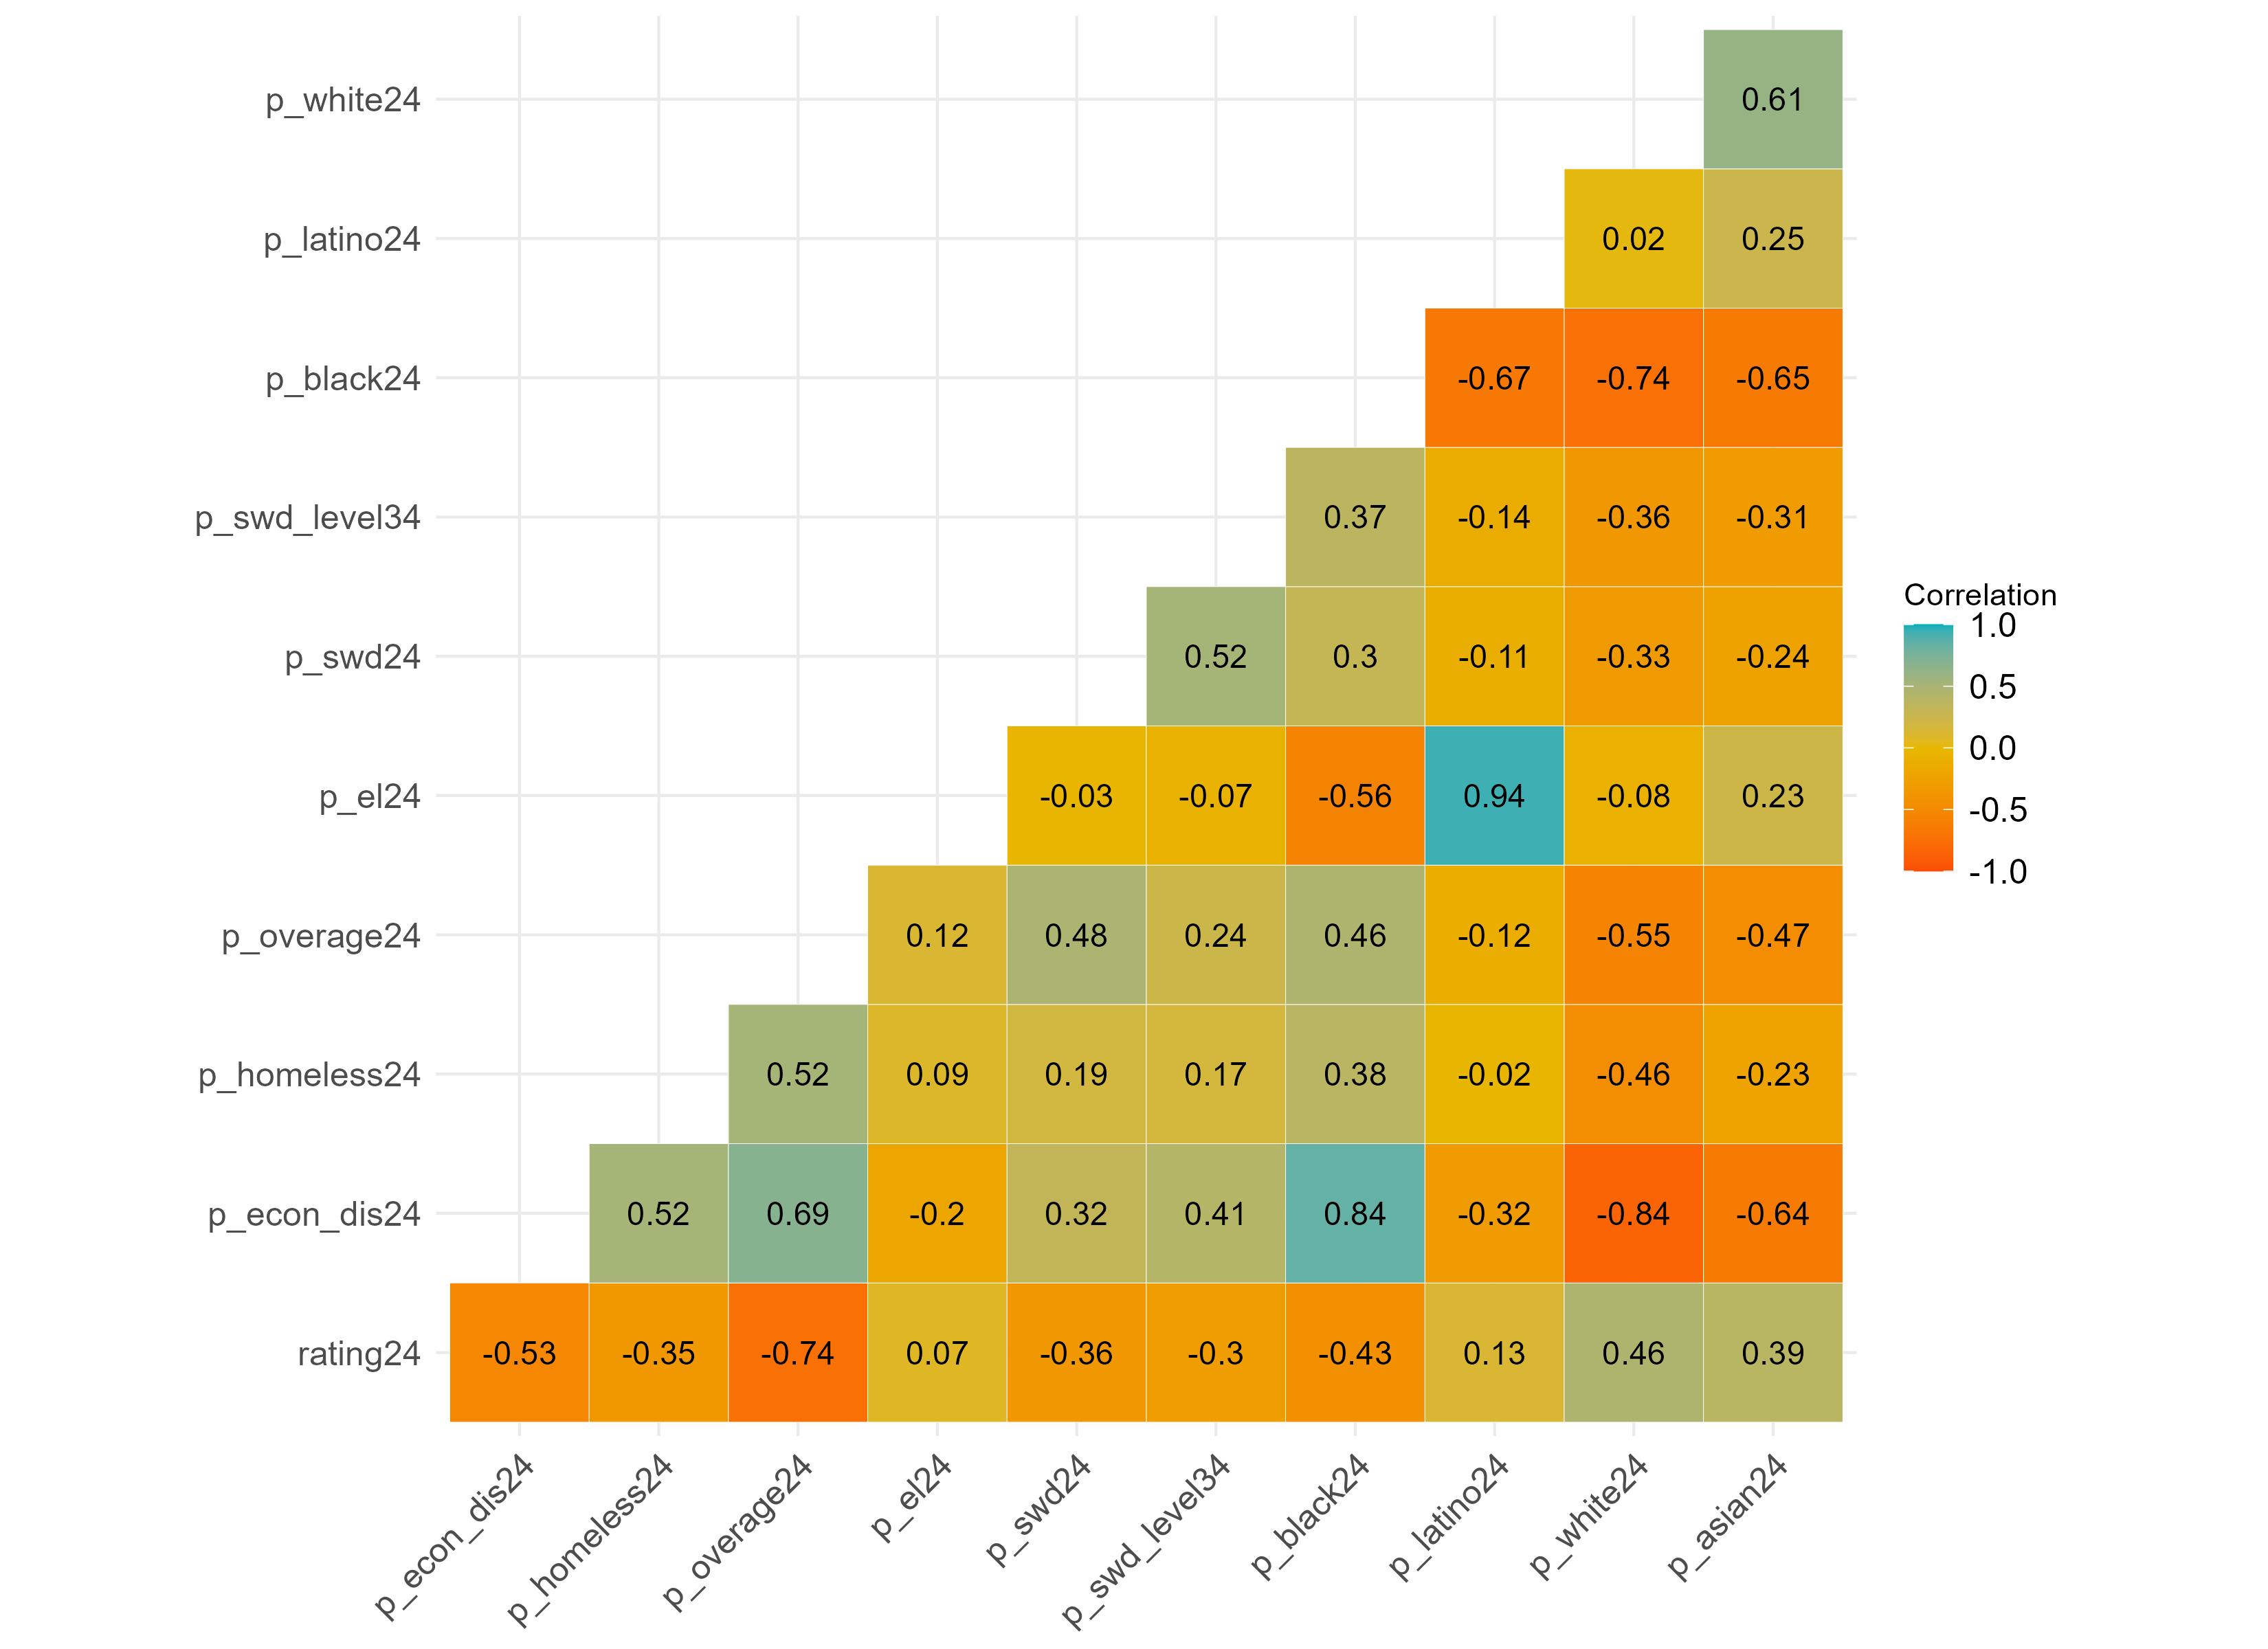
If you’re more of a correlation person, here’s a correlation matrix showing the correlations among school ratings and student characteristics. You can see that percent student economic disadvantage is correlated with the 2024 ratings at -0.52, percent homeless at -0.35, percent students with disabilities at -0.36, and so on.
So how reliable (or stable) are DC school ratings over time?
In recent years, OSSE has weighted growth higher than proficiency levels in calculating the school ratings. The advantage of weighting growth higher than proficiency is that growth is less correlated with student economic disadvantage. The downside of growth metrics, however, is that they are known for being incredibly noisy, which means they are measured with a lot of error and can be all over the place and unreliable. The problem gets worse when you have small sample sizes. DC’s school ratings are partly based on specific subgroups of students within a school, which exacerbates error due to small sample sizes.
The graph below shows the 2024 ratings (y-axis) versus the 2023 ratings (x-axis). The diagonal line would be if the schools received the same rating over the two consecutive years. You can see that some school ratings changed dramatically from one year to the next. This means that either the school quality wildly changed within a year (very unlikely) or that the ratings were measured with a lot of error such that the ratings weren’t that trustworthy to begin with (very likely), or both.

Below is another way to visualize how much individual school ratings changed from one year to the next, where the vertical movement reflects change in ratings. About 25% of schools had year-to-year ratings within 5 percentage points of one another, 25% had ratings that changed between 5-9 percentage points, 25% had ratings that changed between 10-15 percentage points, and 25% had ratings that changed by 15+ percentage points, The two wildest fluctuations were JO Wilson, which went from being rated 25% in 2023 to 78% in 2024, and Roots, which went from 73% in 2023 to 12% in 2024. These dramatic shifts strain credibility.
So we do we keep assigning school ratings if they’re not equitable or reliable?
Assigning blame to individual schools is way easier than taking individual or collective responsibility for our educational system. If low rated schools are really “bad”, then I don’t have to worry about explaining why I’m opting out of low rated schools as a parent. And if low ratings are really the school’s fault, then we don’t have to worry about investing resources collectively to address the unequal opportunities in education.
The federal government requires OSSE to identify the lowest performing 5% of schools, but as OSSE notes, there is little federal funding that comes with the lowest performing designation, and at this time, OSSE isn’t providing extra funding to these schools. So we assign schools low ratings and then do nothing. For this reason, the ratings seem to be more about propping up the educational system we have more than anything else.
But don’t we need some way of knowing whether schools are doing a good job?
Yes. There are other statistical methods that can be used to better and more reliably isolate a school’s contribution to learning. But even the best statistical methods may be based on only one test, and school quality is more than that. School quality is complex, multifaceted, and relational, and it cannot be summed up in a single number.
I am NOT advocating for NO accountability or to ignore all of the data. What I’m saying is that the school ratings we have don’t really tell us which schools are doing a good job, and may not be very reliable. And to make matters worse, the ratings are inequitable and likely lead to further inequity.
I think we should rate schools based on what they actually do, not based on who they serve. I think we should use broader metrics than one test and attendance. And I think we should move from blaming individual schools to supporting schools, including taking individual and collective responsibility for our educational system.

Data notes & bonus graphs:
[1] I calculated this using student characteristics from the CAPE files because the vast majority of the school ratings come from CAPE metrics, particularly for elementary and middle schools. In cases when OSSE slightly suppressed the data, I made reasonable assumptions (like <5% was coded as 5%). When OSSE really suppressed the data, I used student characteristics from OSSE’s enrollment audit files instead. Therefore, the percentages for student characteristics are not exact but rather are an estimate.
Please note also that this is a volunteer effort. If you see obvious errors, let me know, and I will correct them.