Aand DC's PARCC Scores Over Time

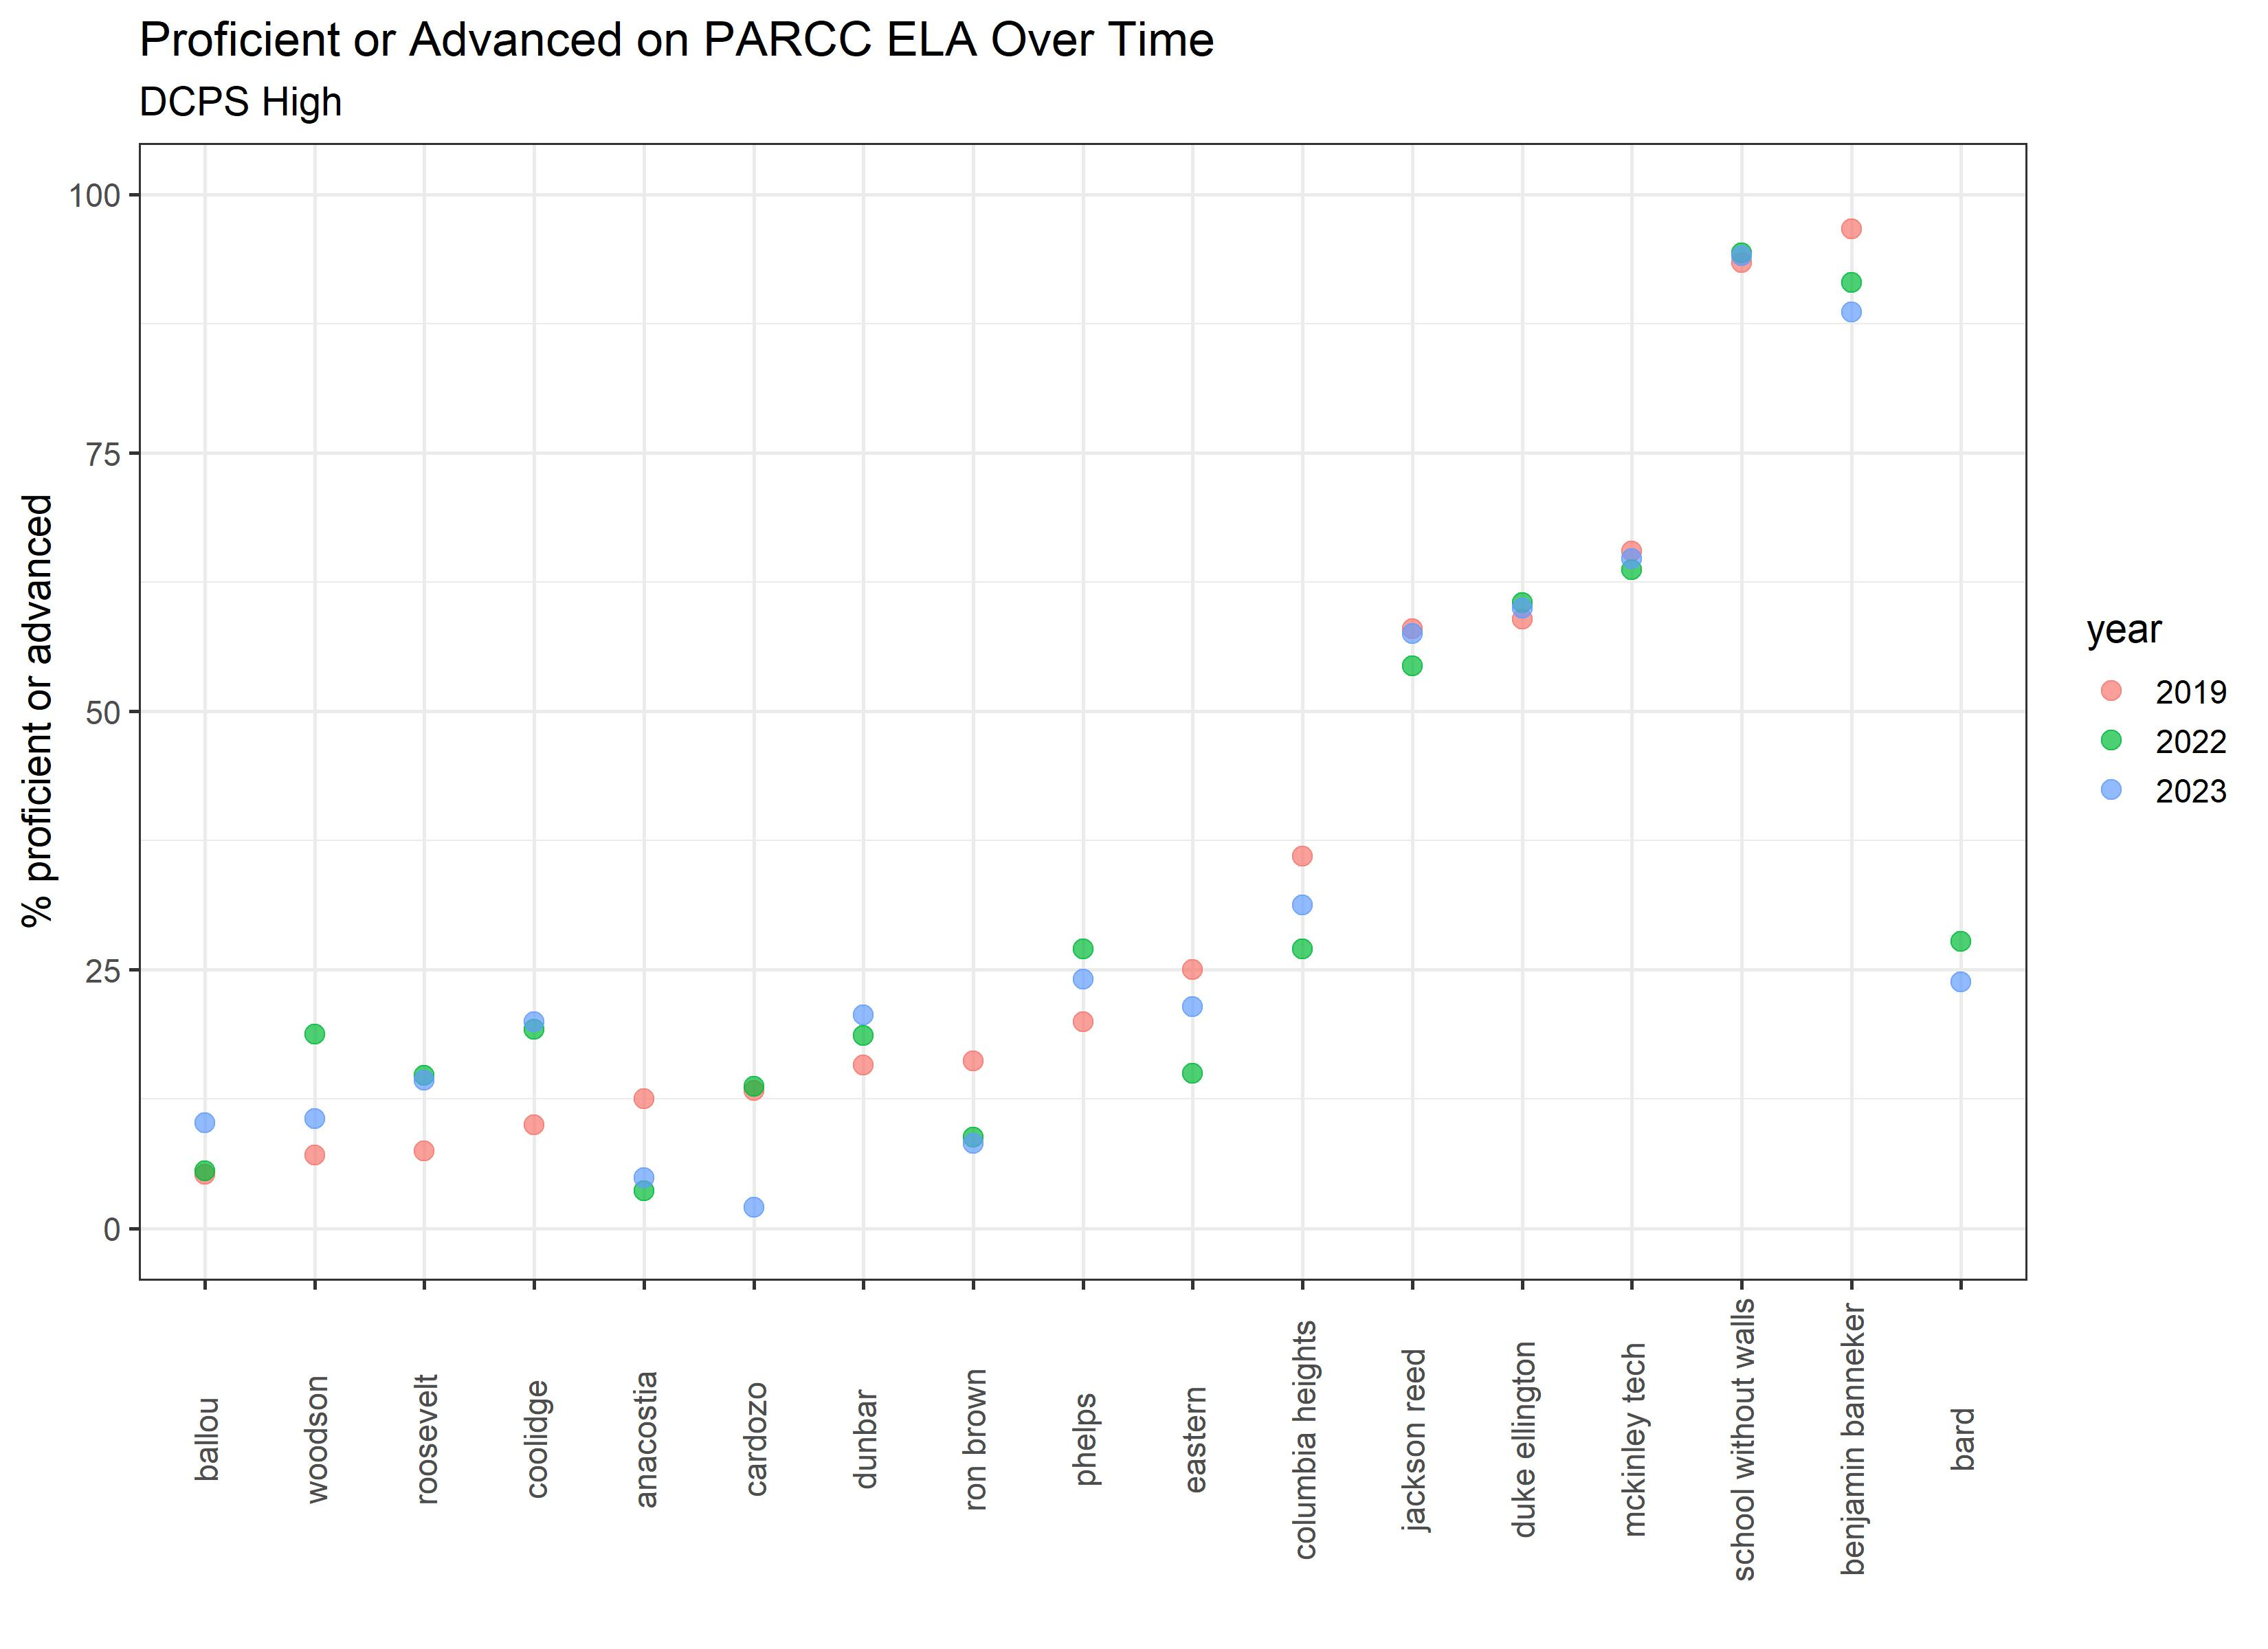
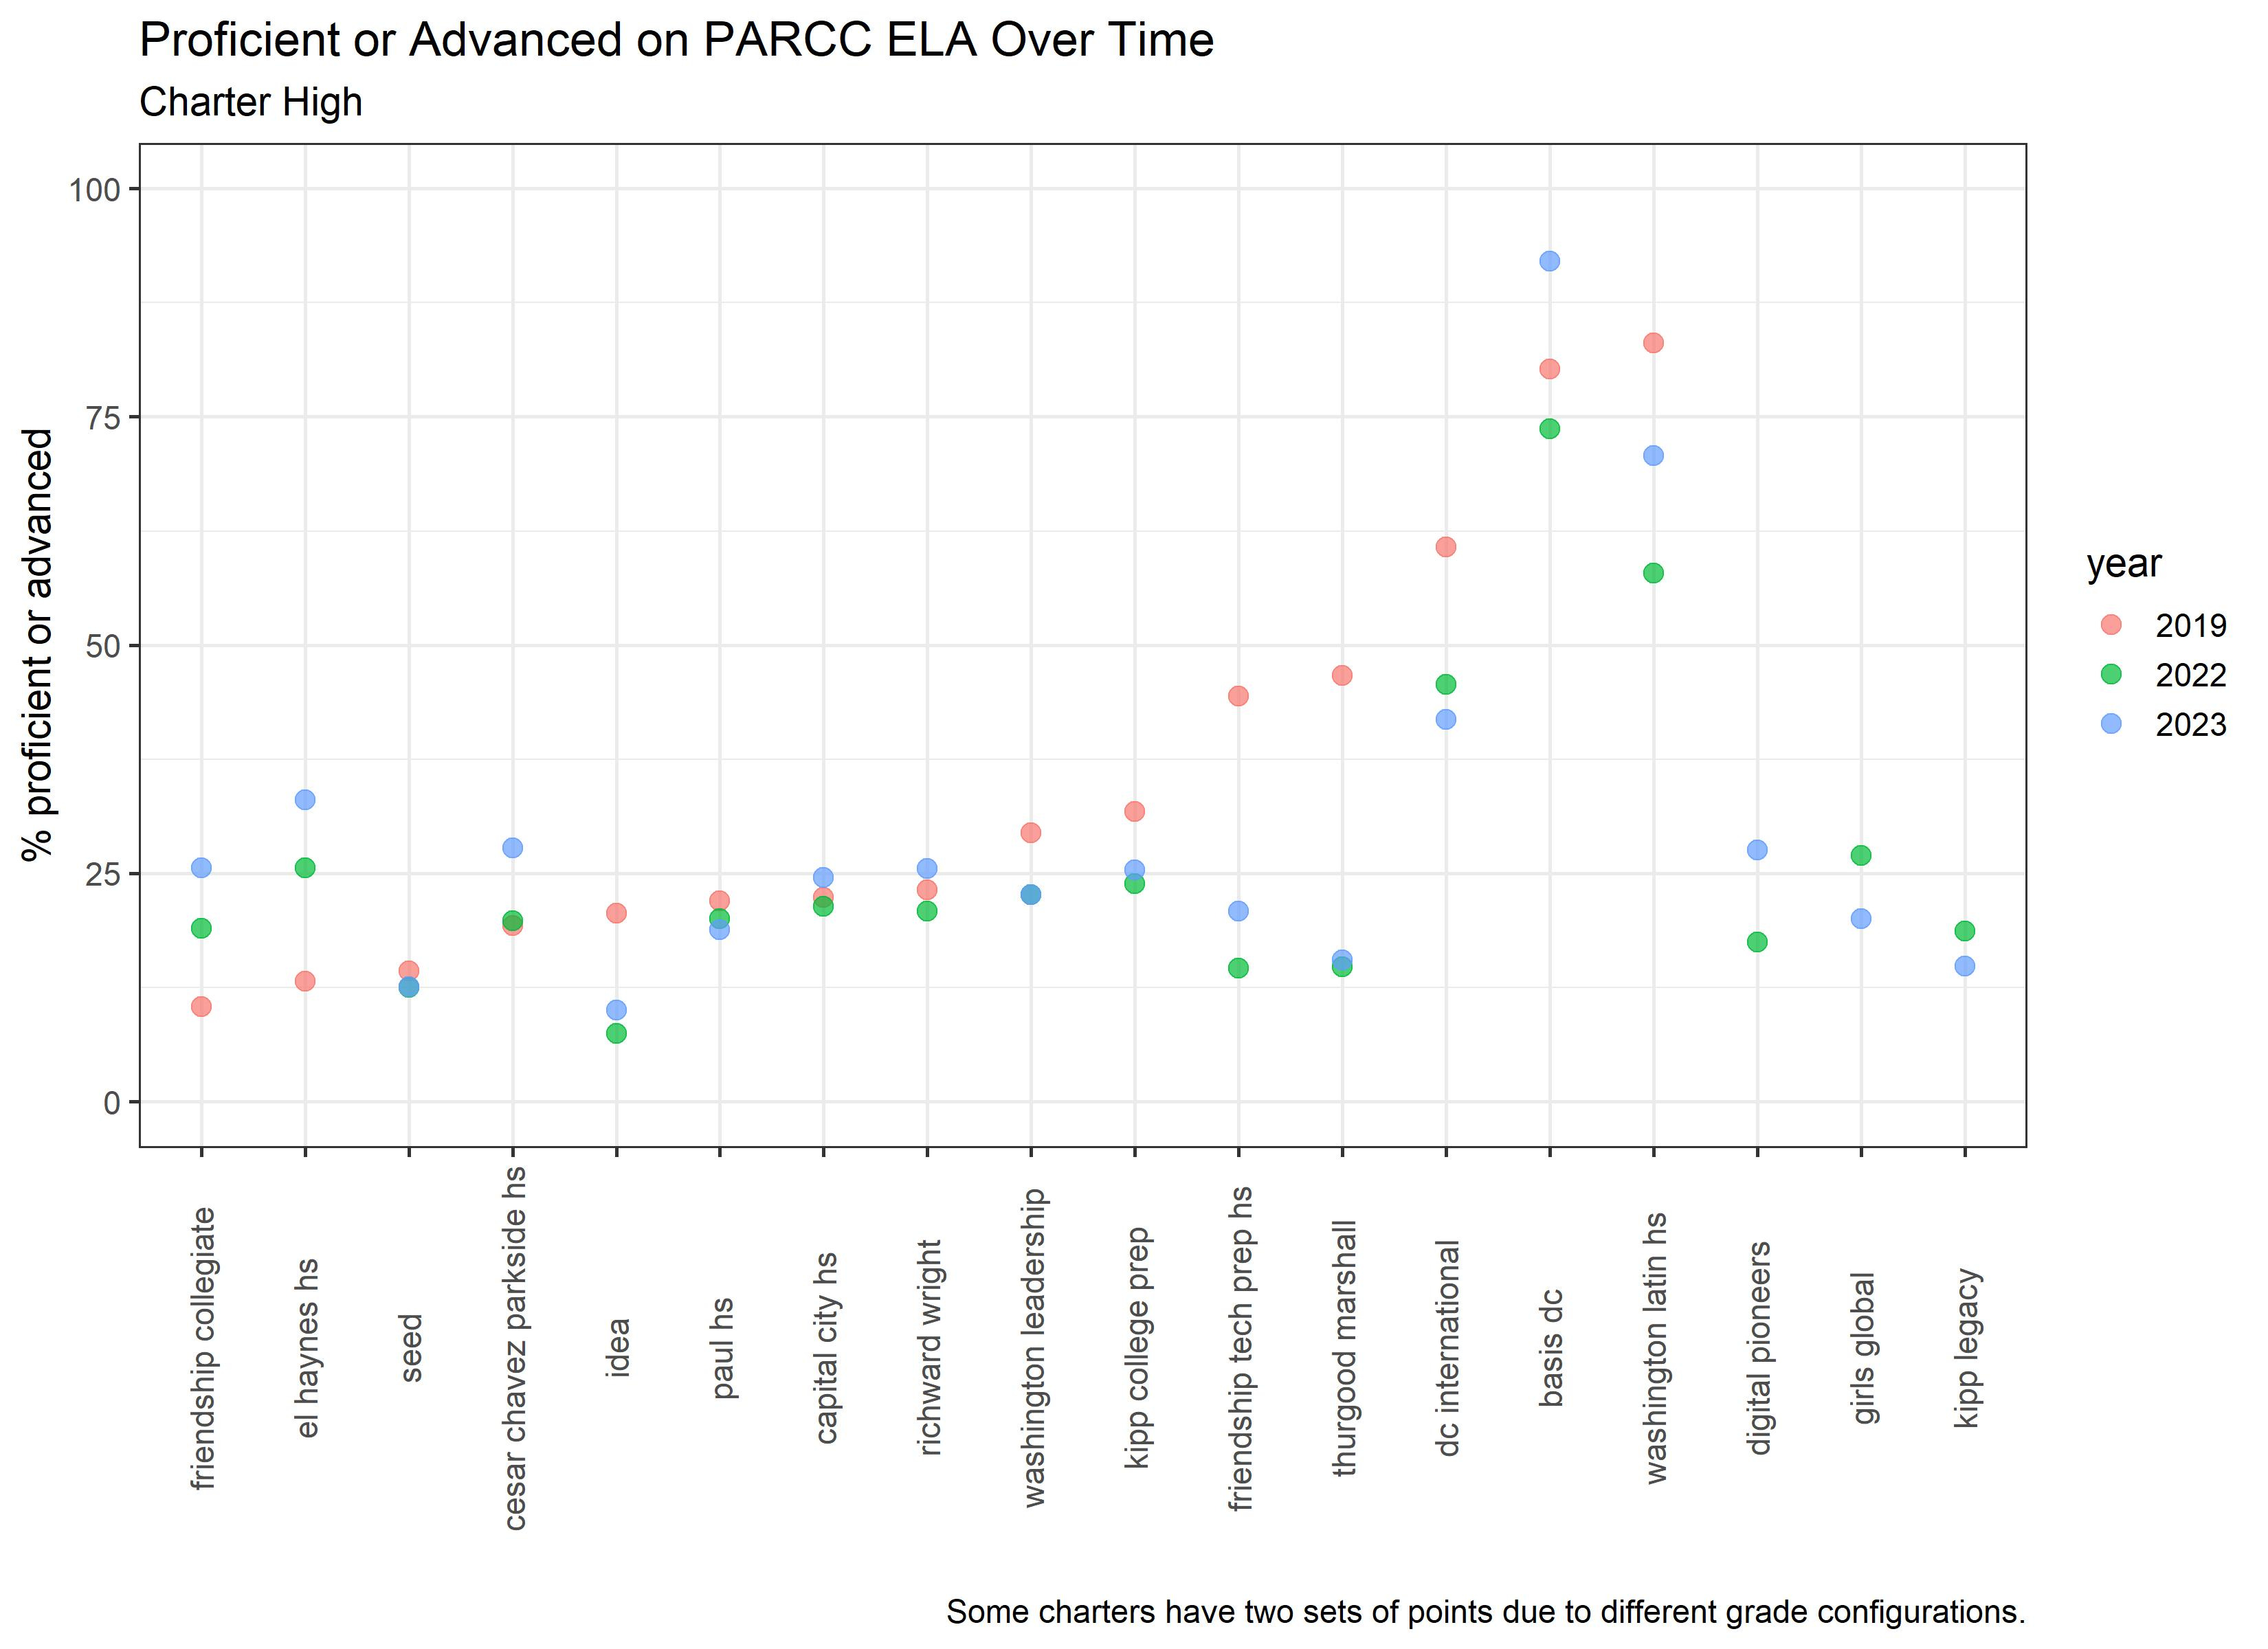
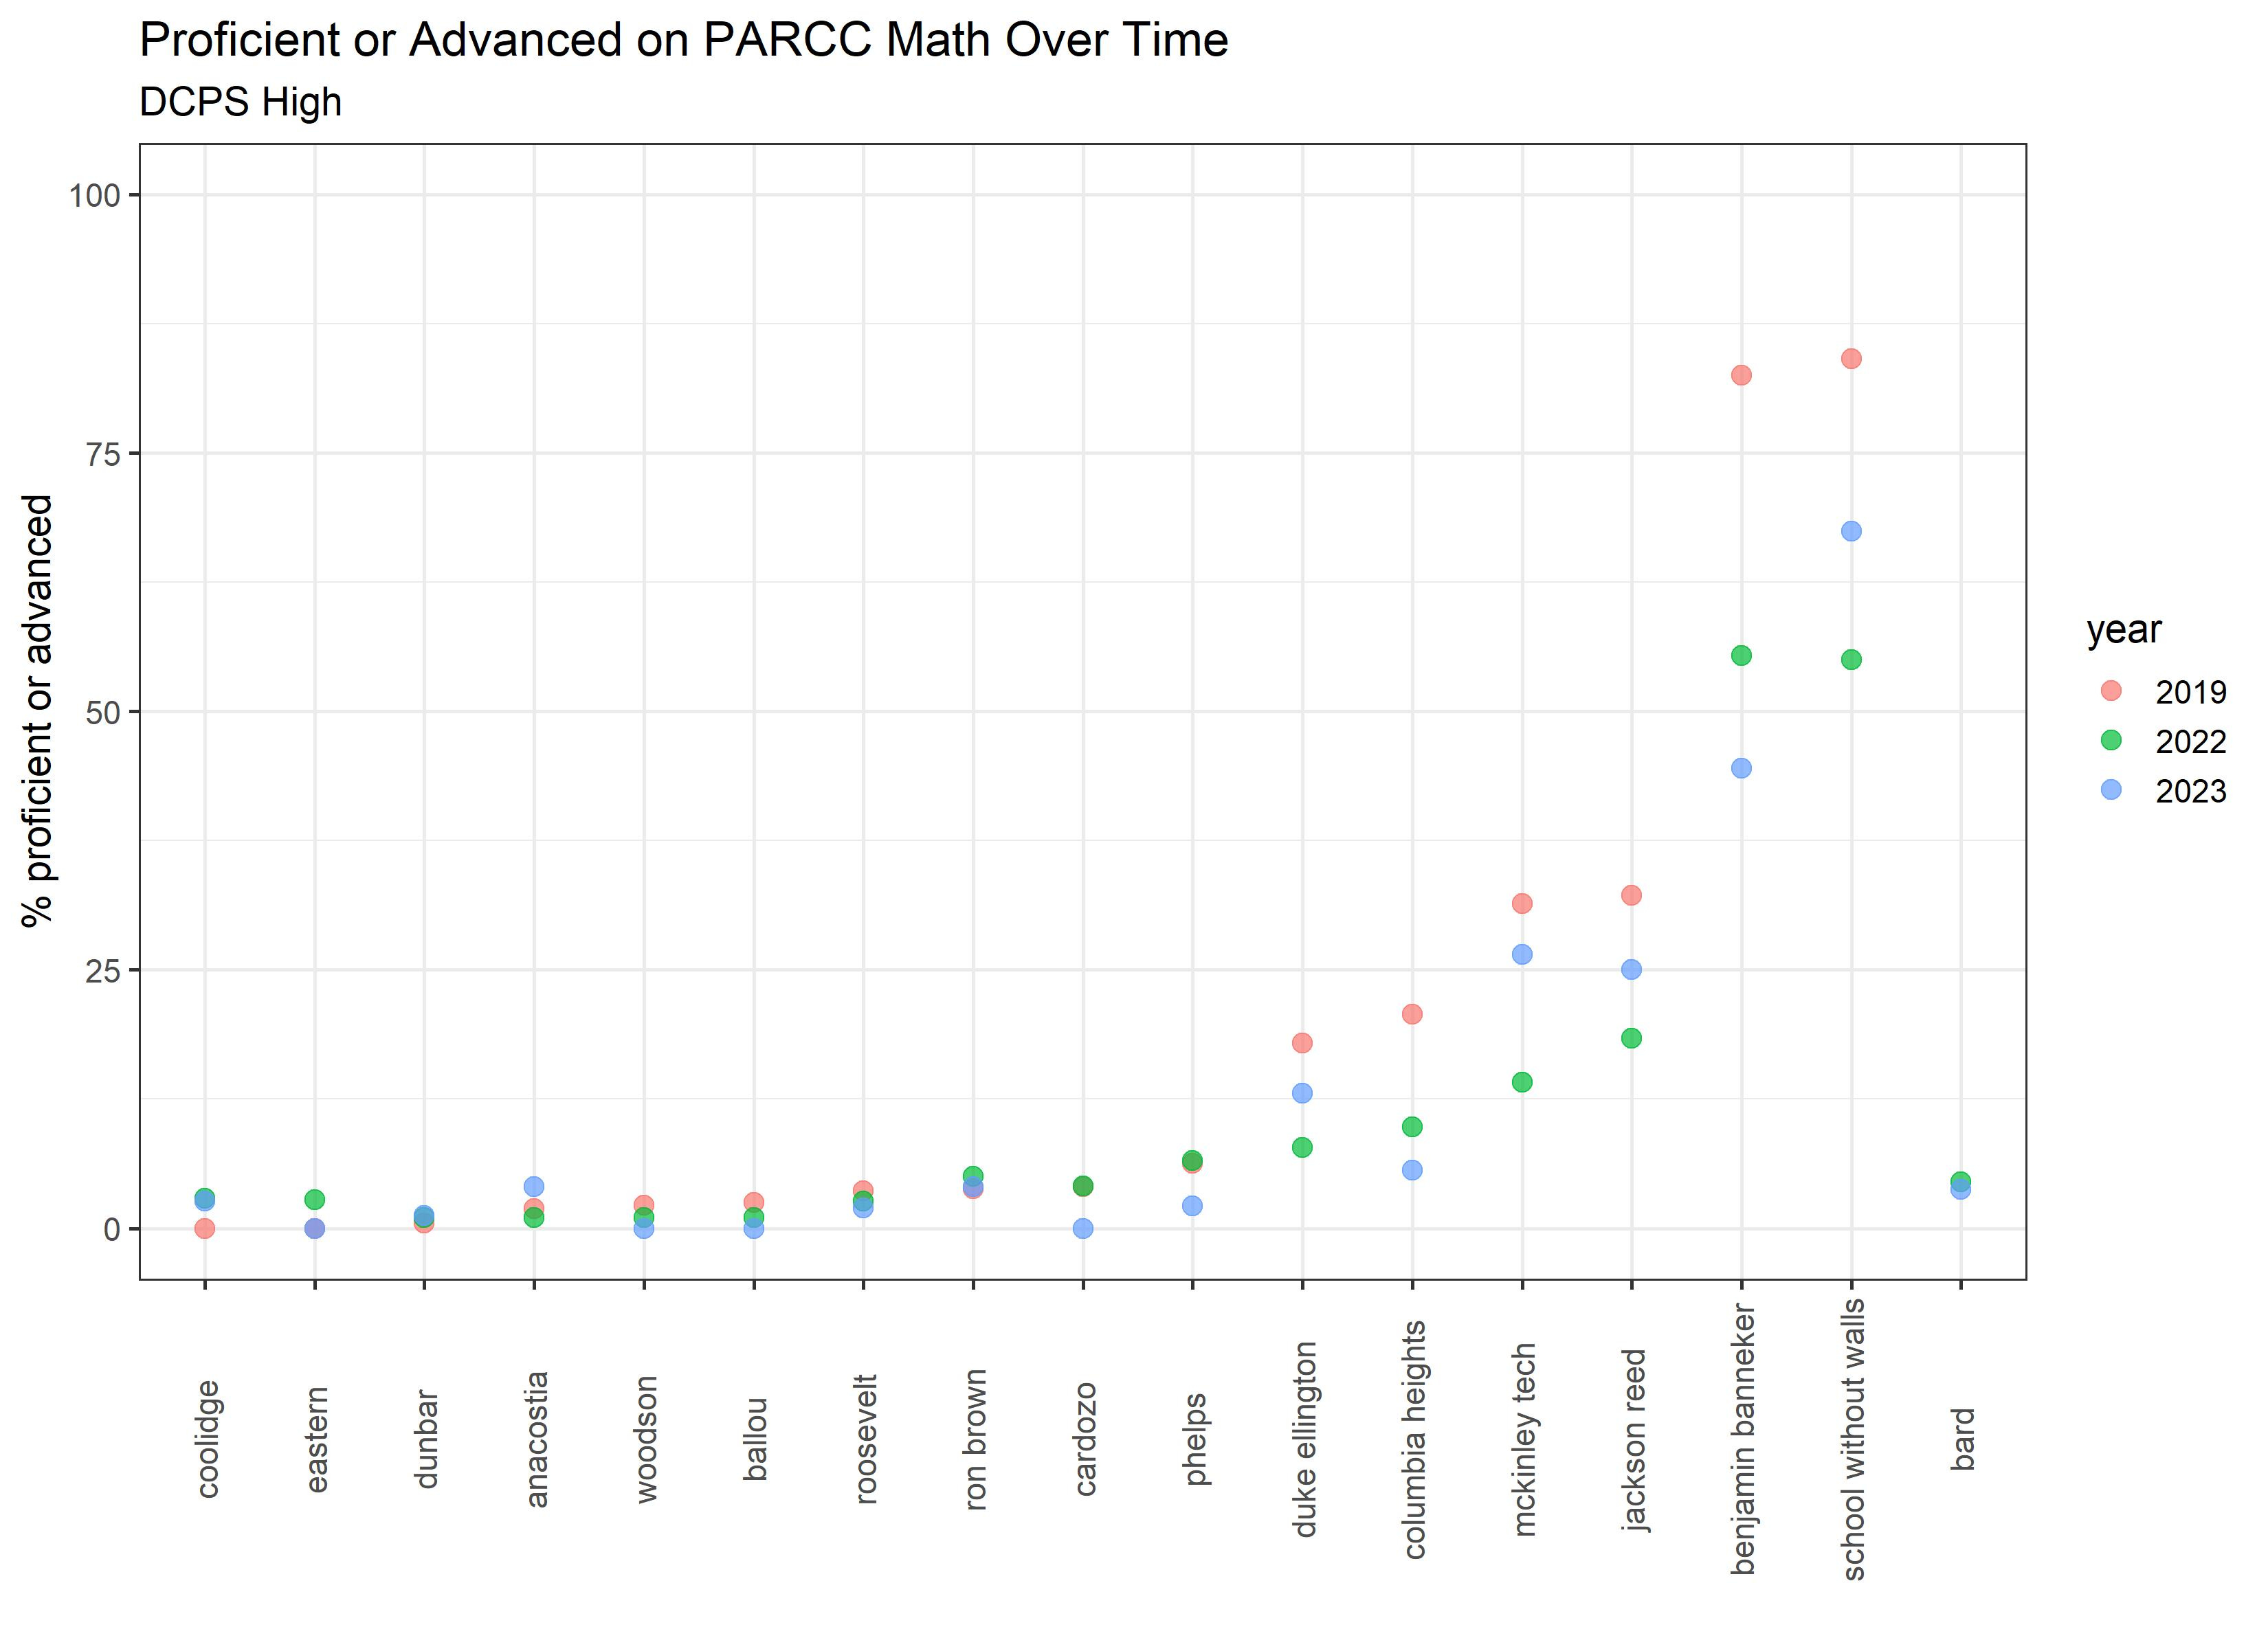
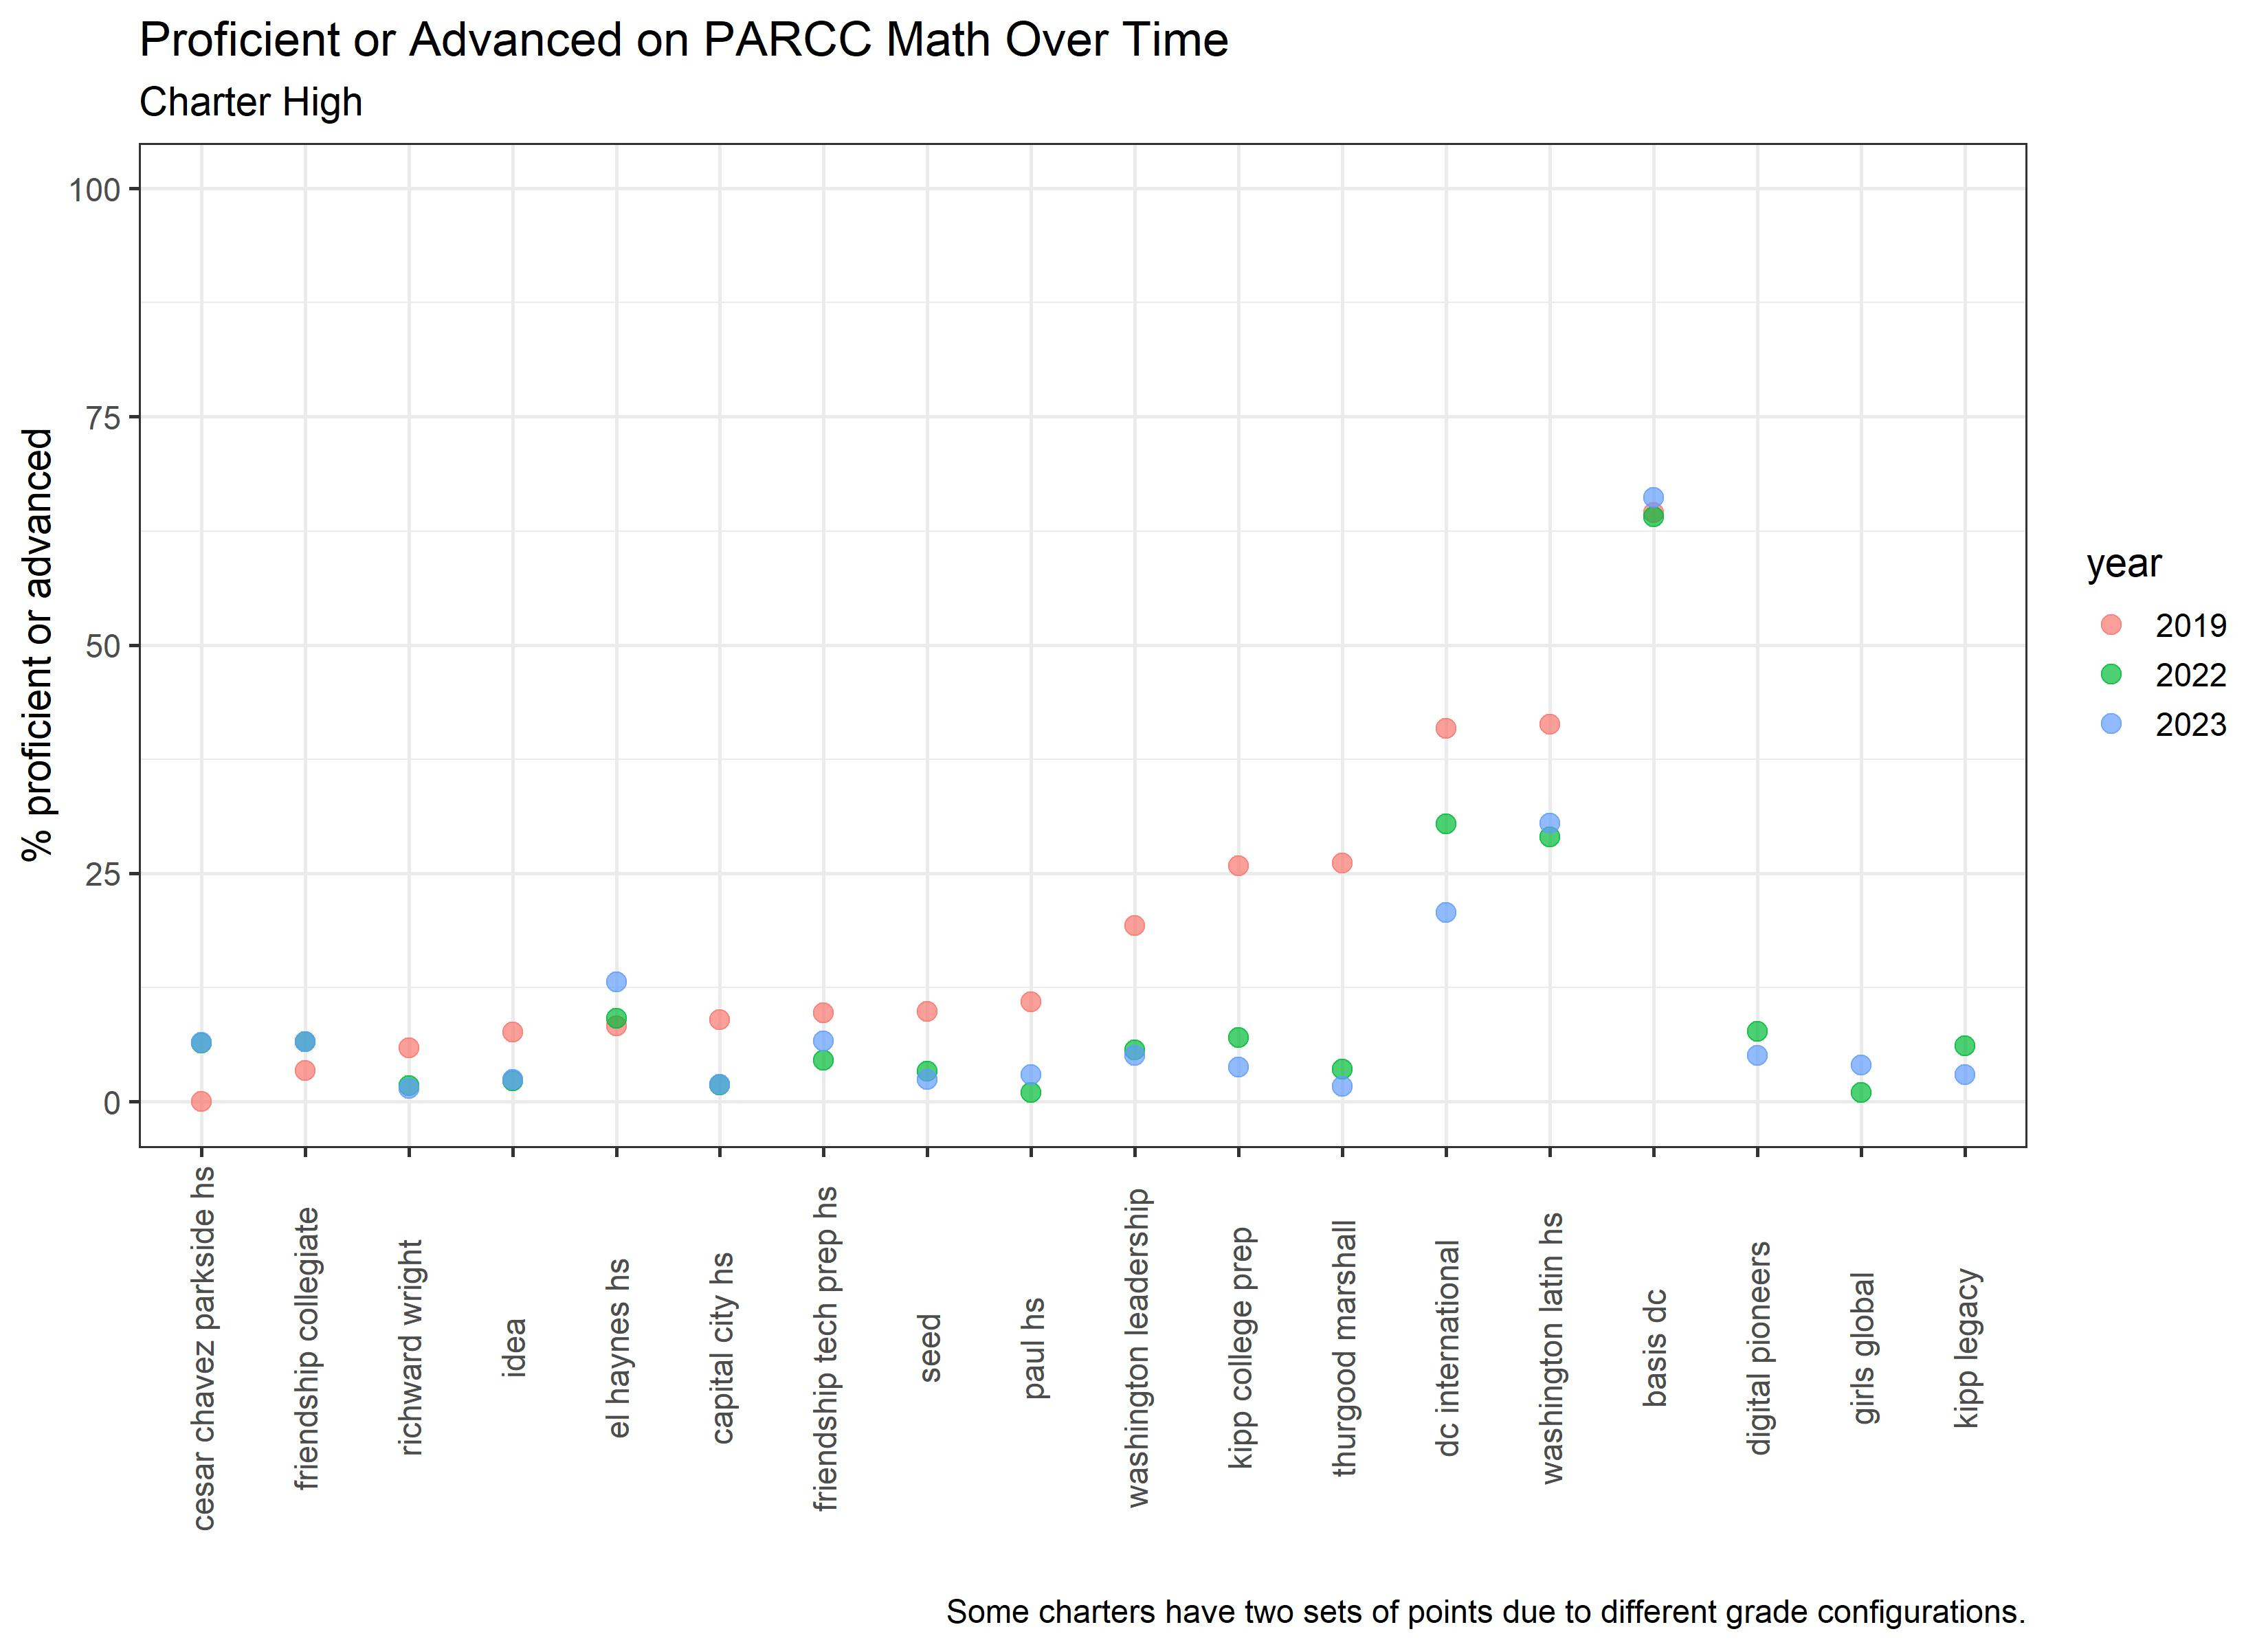
Upon request, I’ve created graphs showing proficiency rates for DC public schools in 2019 (last year before the pandemic), 2022, and 2023. The key take-away for me is that proficiency rates are still substantially lower than they were in 2019. The blue and green dots representing proficiency rates in 2022 and 2023, respectively, jump around, and given a margin of error, I don’t know that we have enough information to know whether 2023 was really an improvement over 2022. Also, given that 82% of the variation in DC proficiency rates is explained by student characteristics - largely access to resources - any large jumps in proficiency rates for any school probably has more to do with changes in student populations over time than changes in instructional quality. Changes in student populations might mean different students with different characteristics, or students that were disproportionately impacted by the pandemic.
ELEMENTARY:
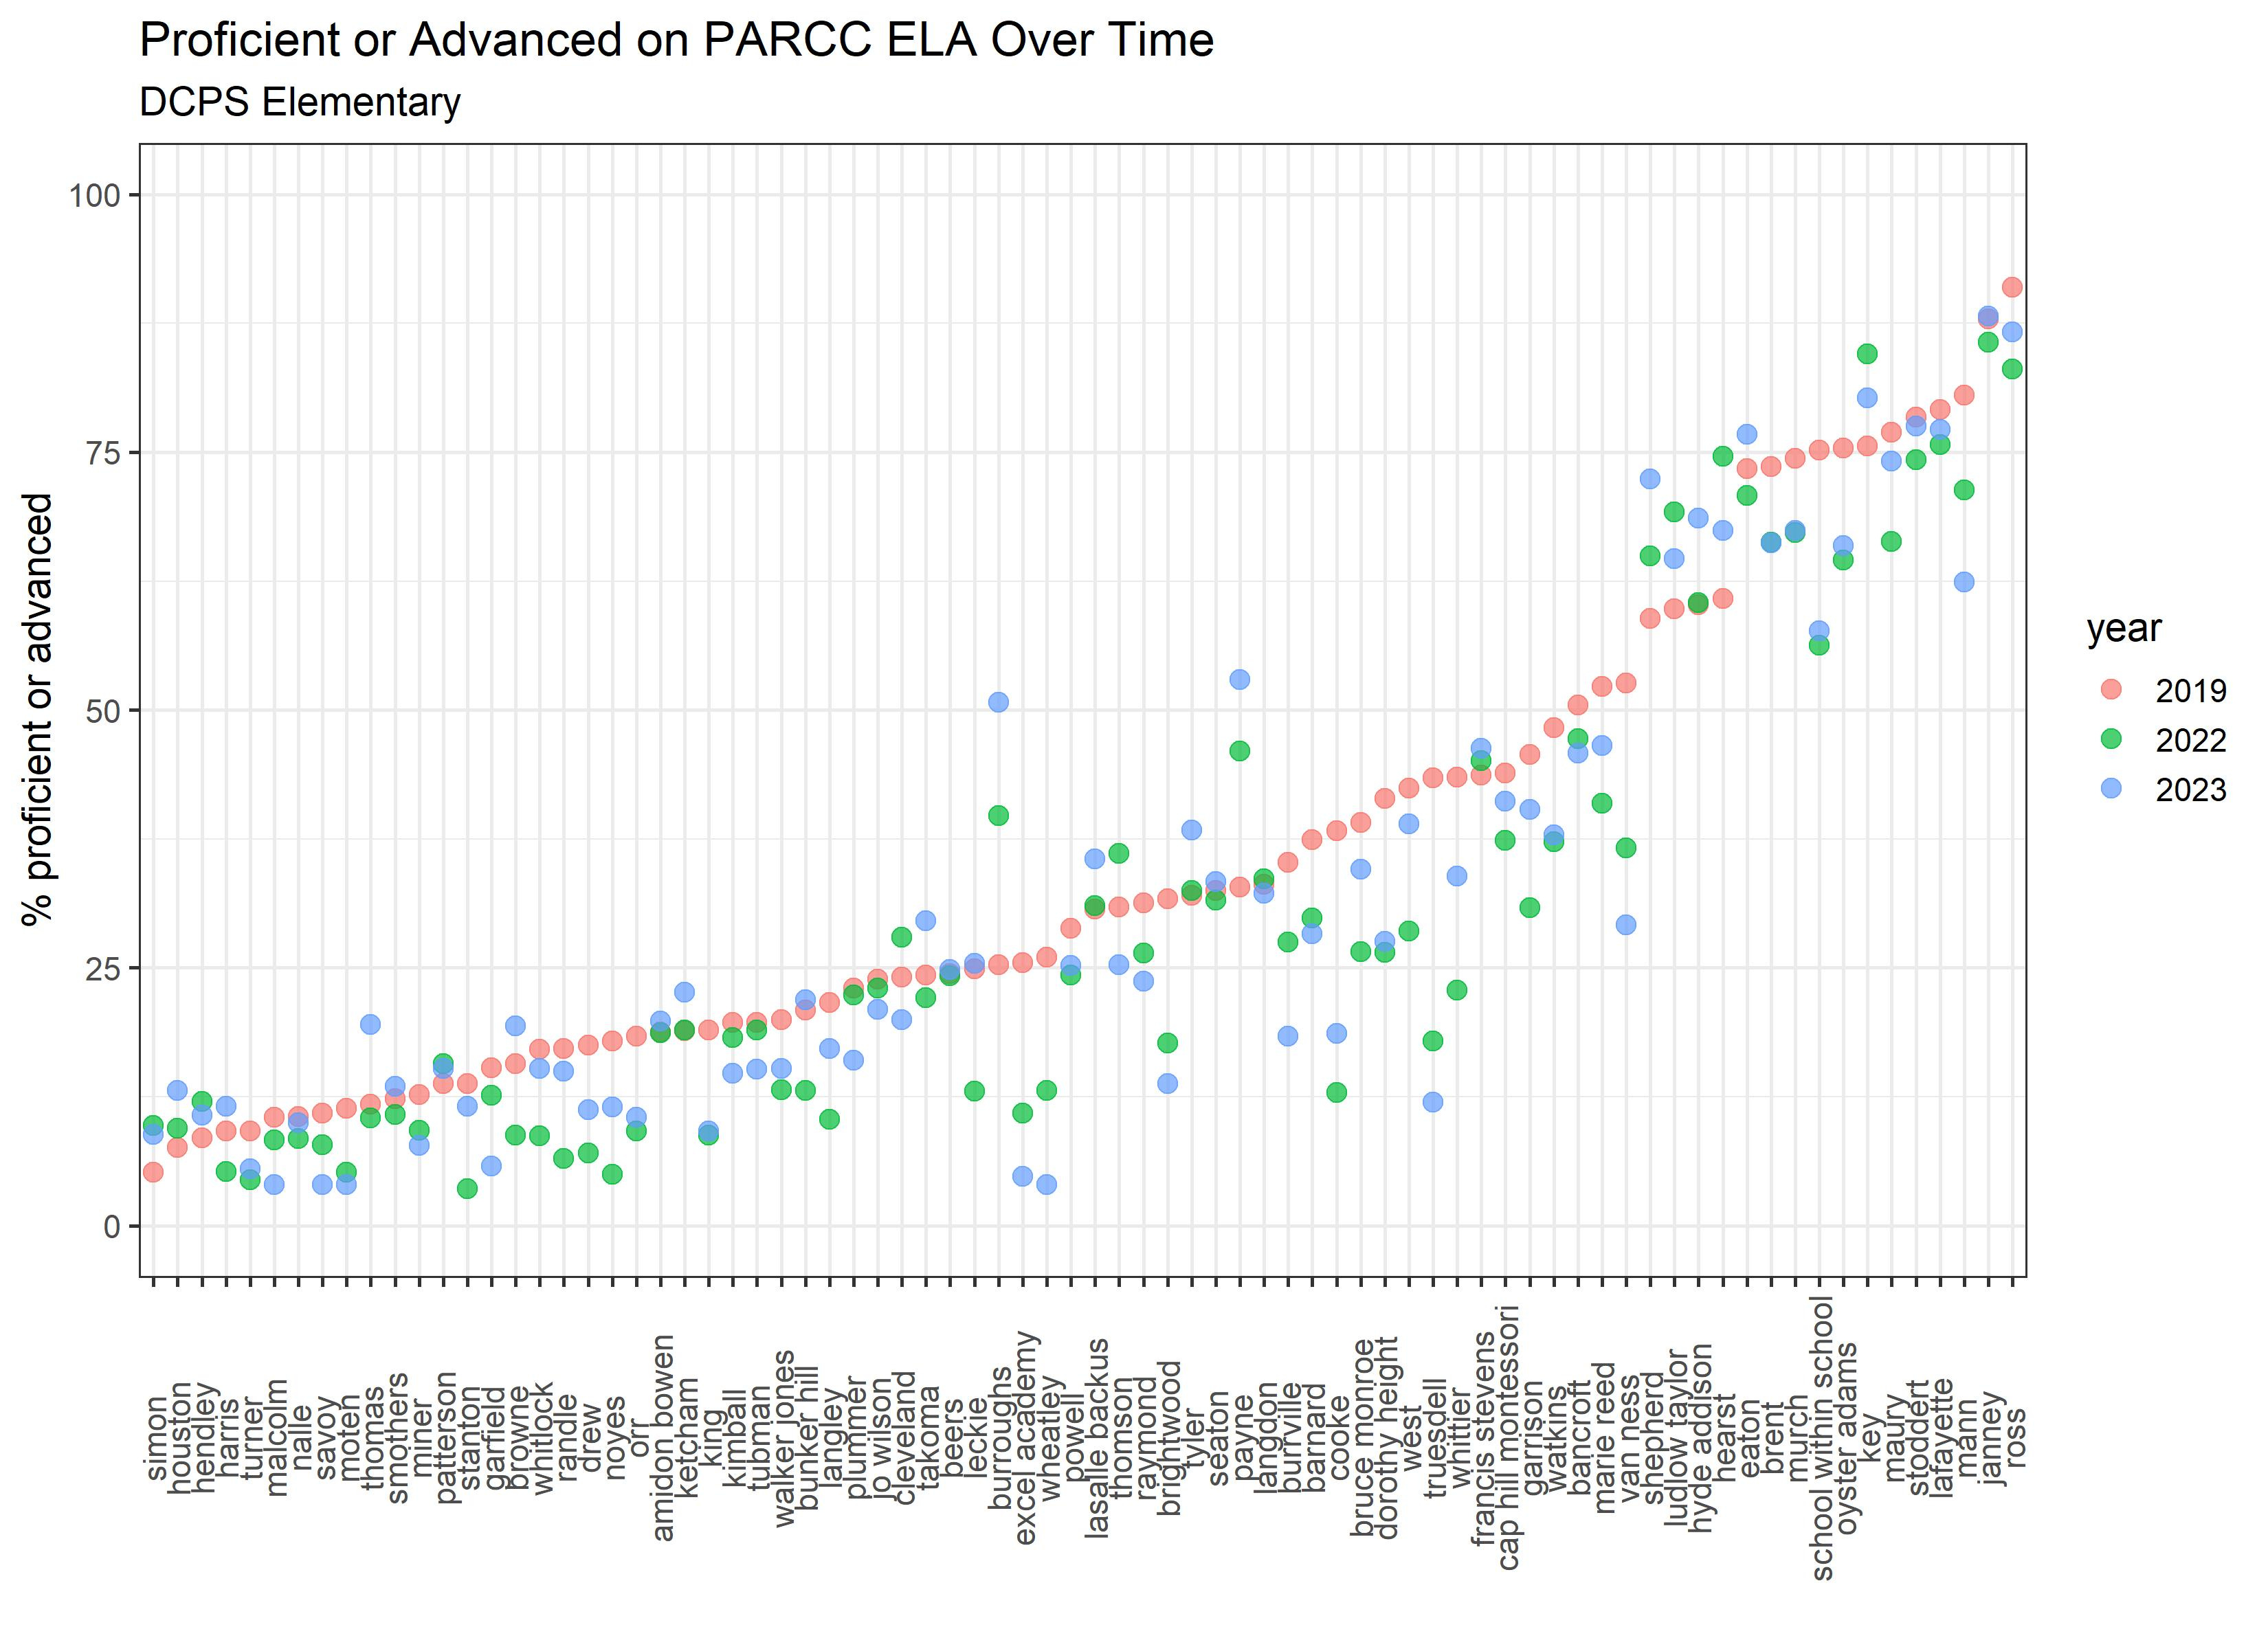
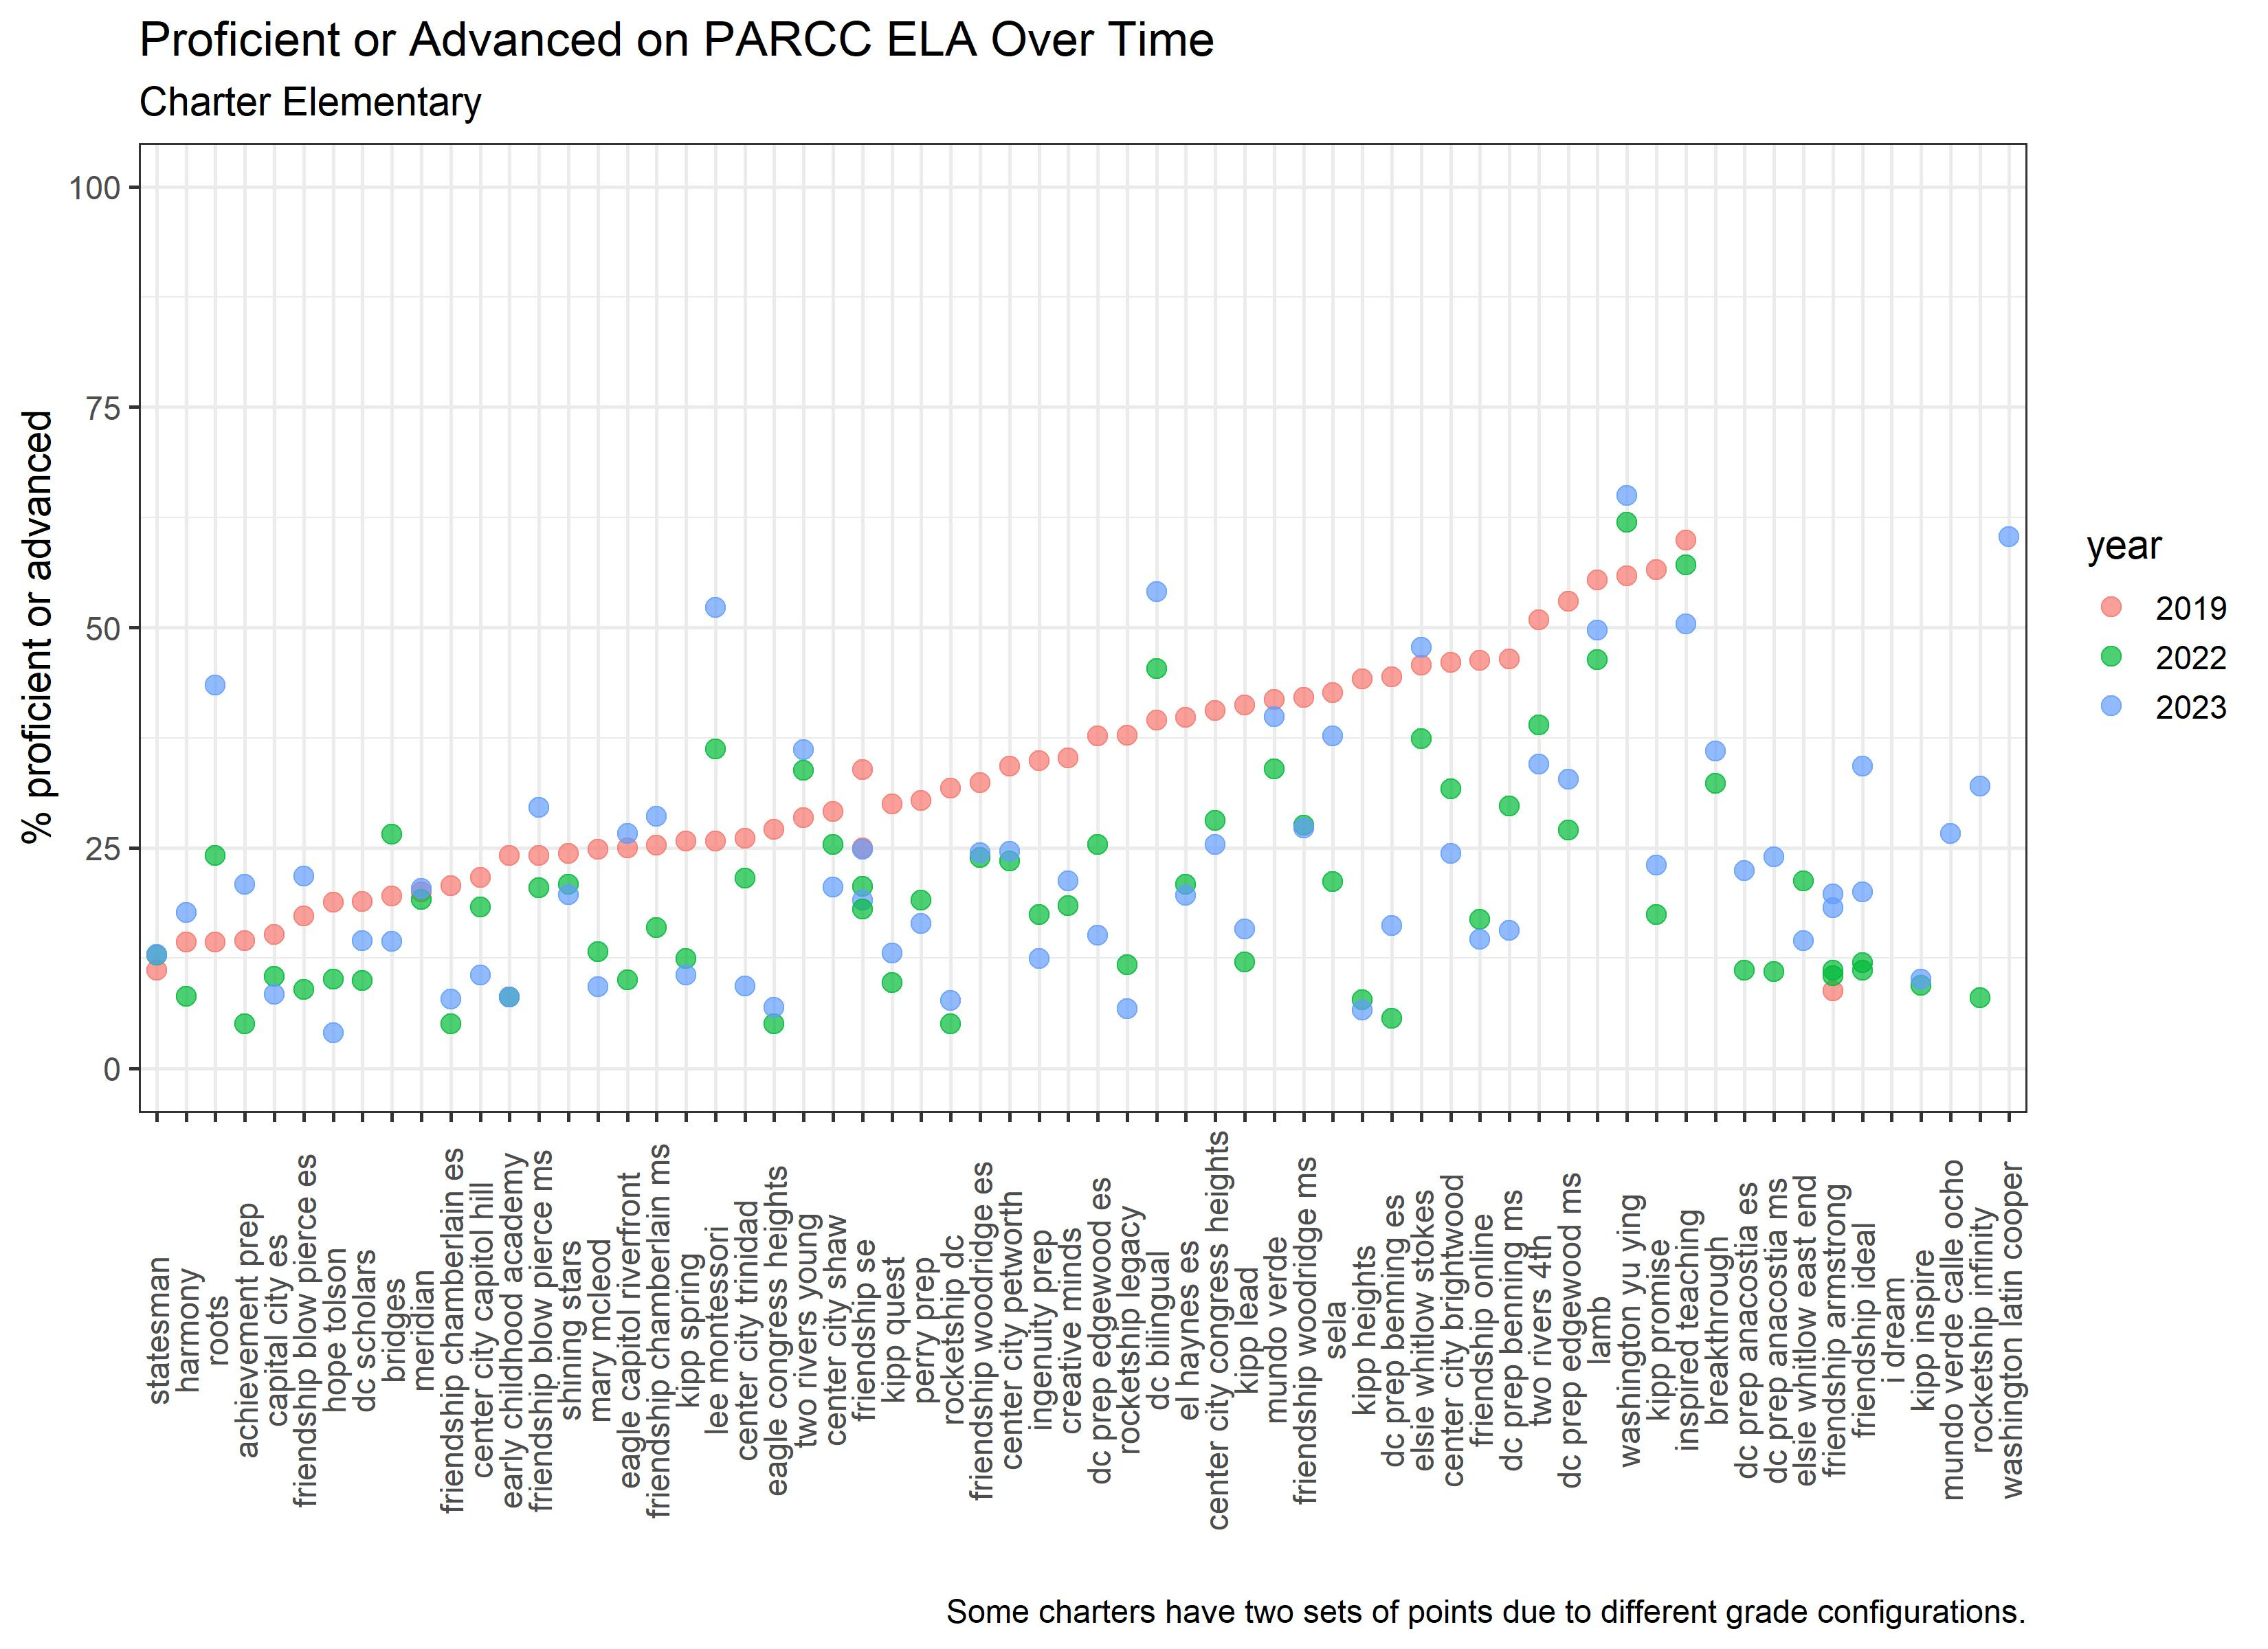
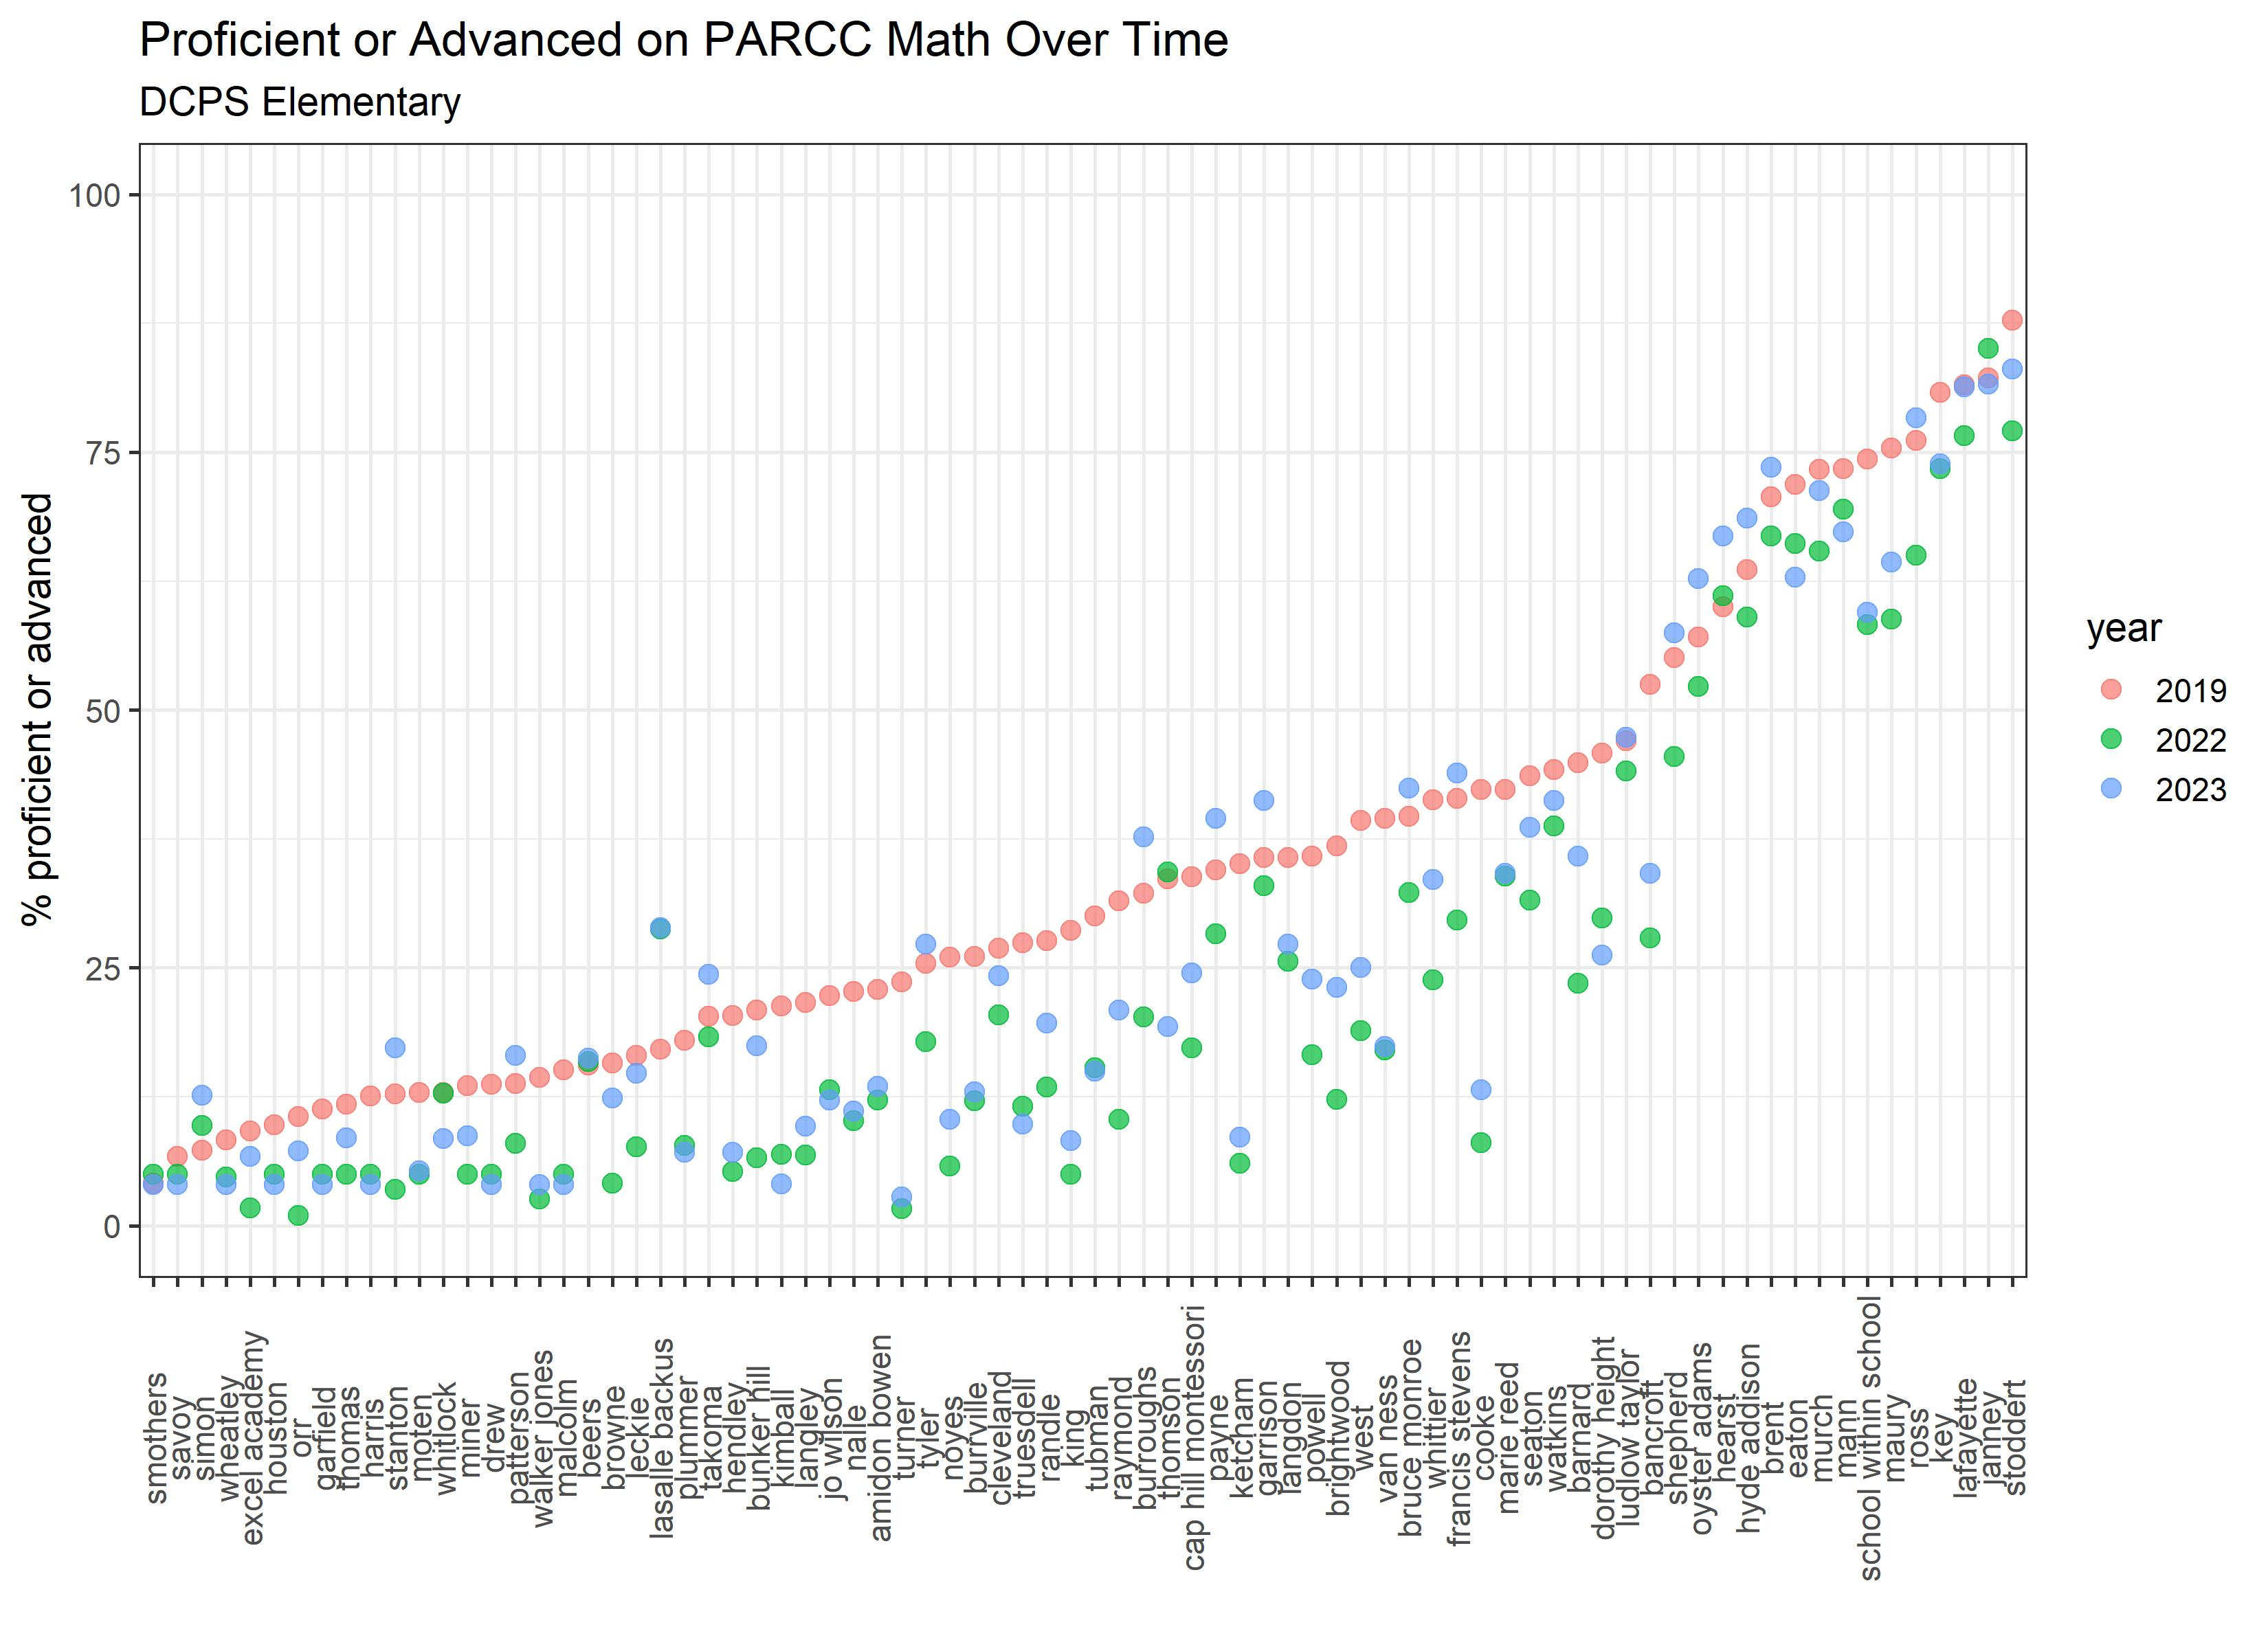
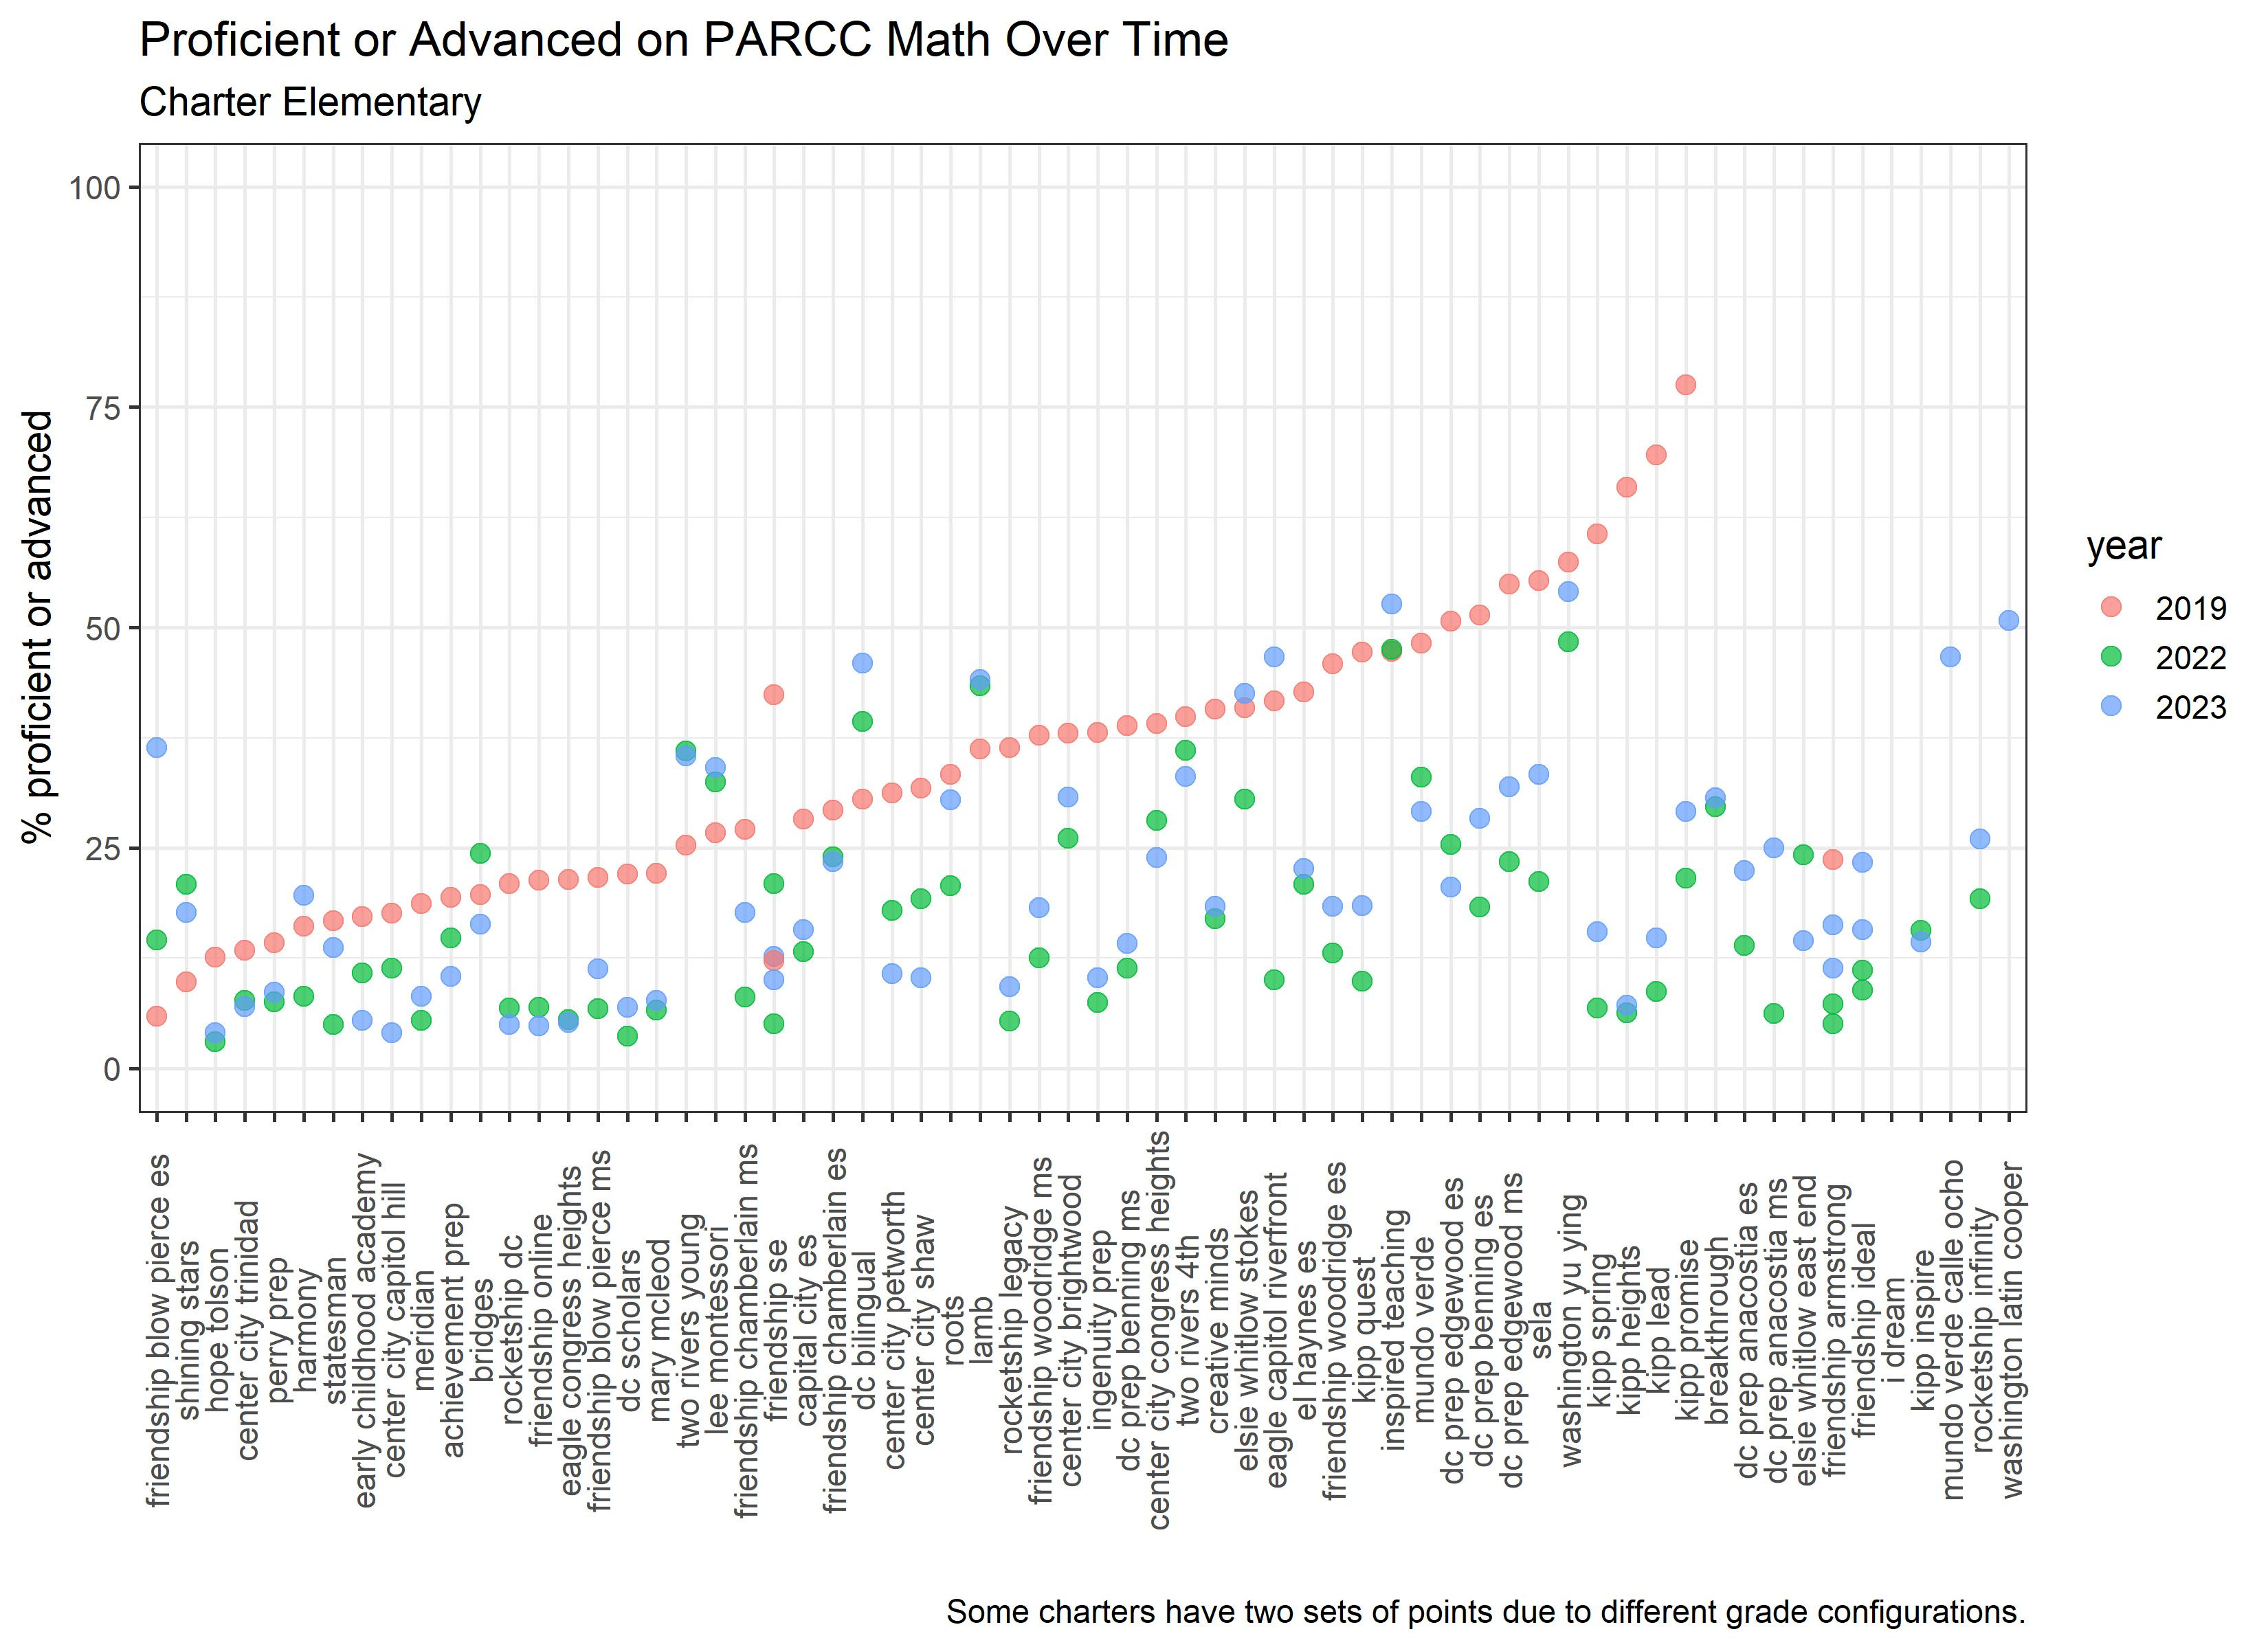
The second take-away for me is how little proficiency rates changed at some schools serving predominantly students from affluent families. This drives home the point that the fallout from the pandemic was not equally experienced by all families. Well-resourced schools also likely had easier shifts to virtual learning given better education technology resources.
MIDDLE:
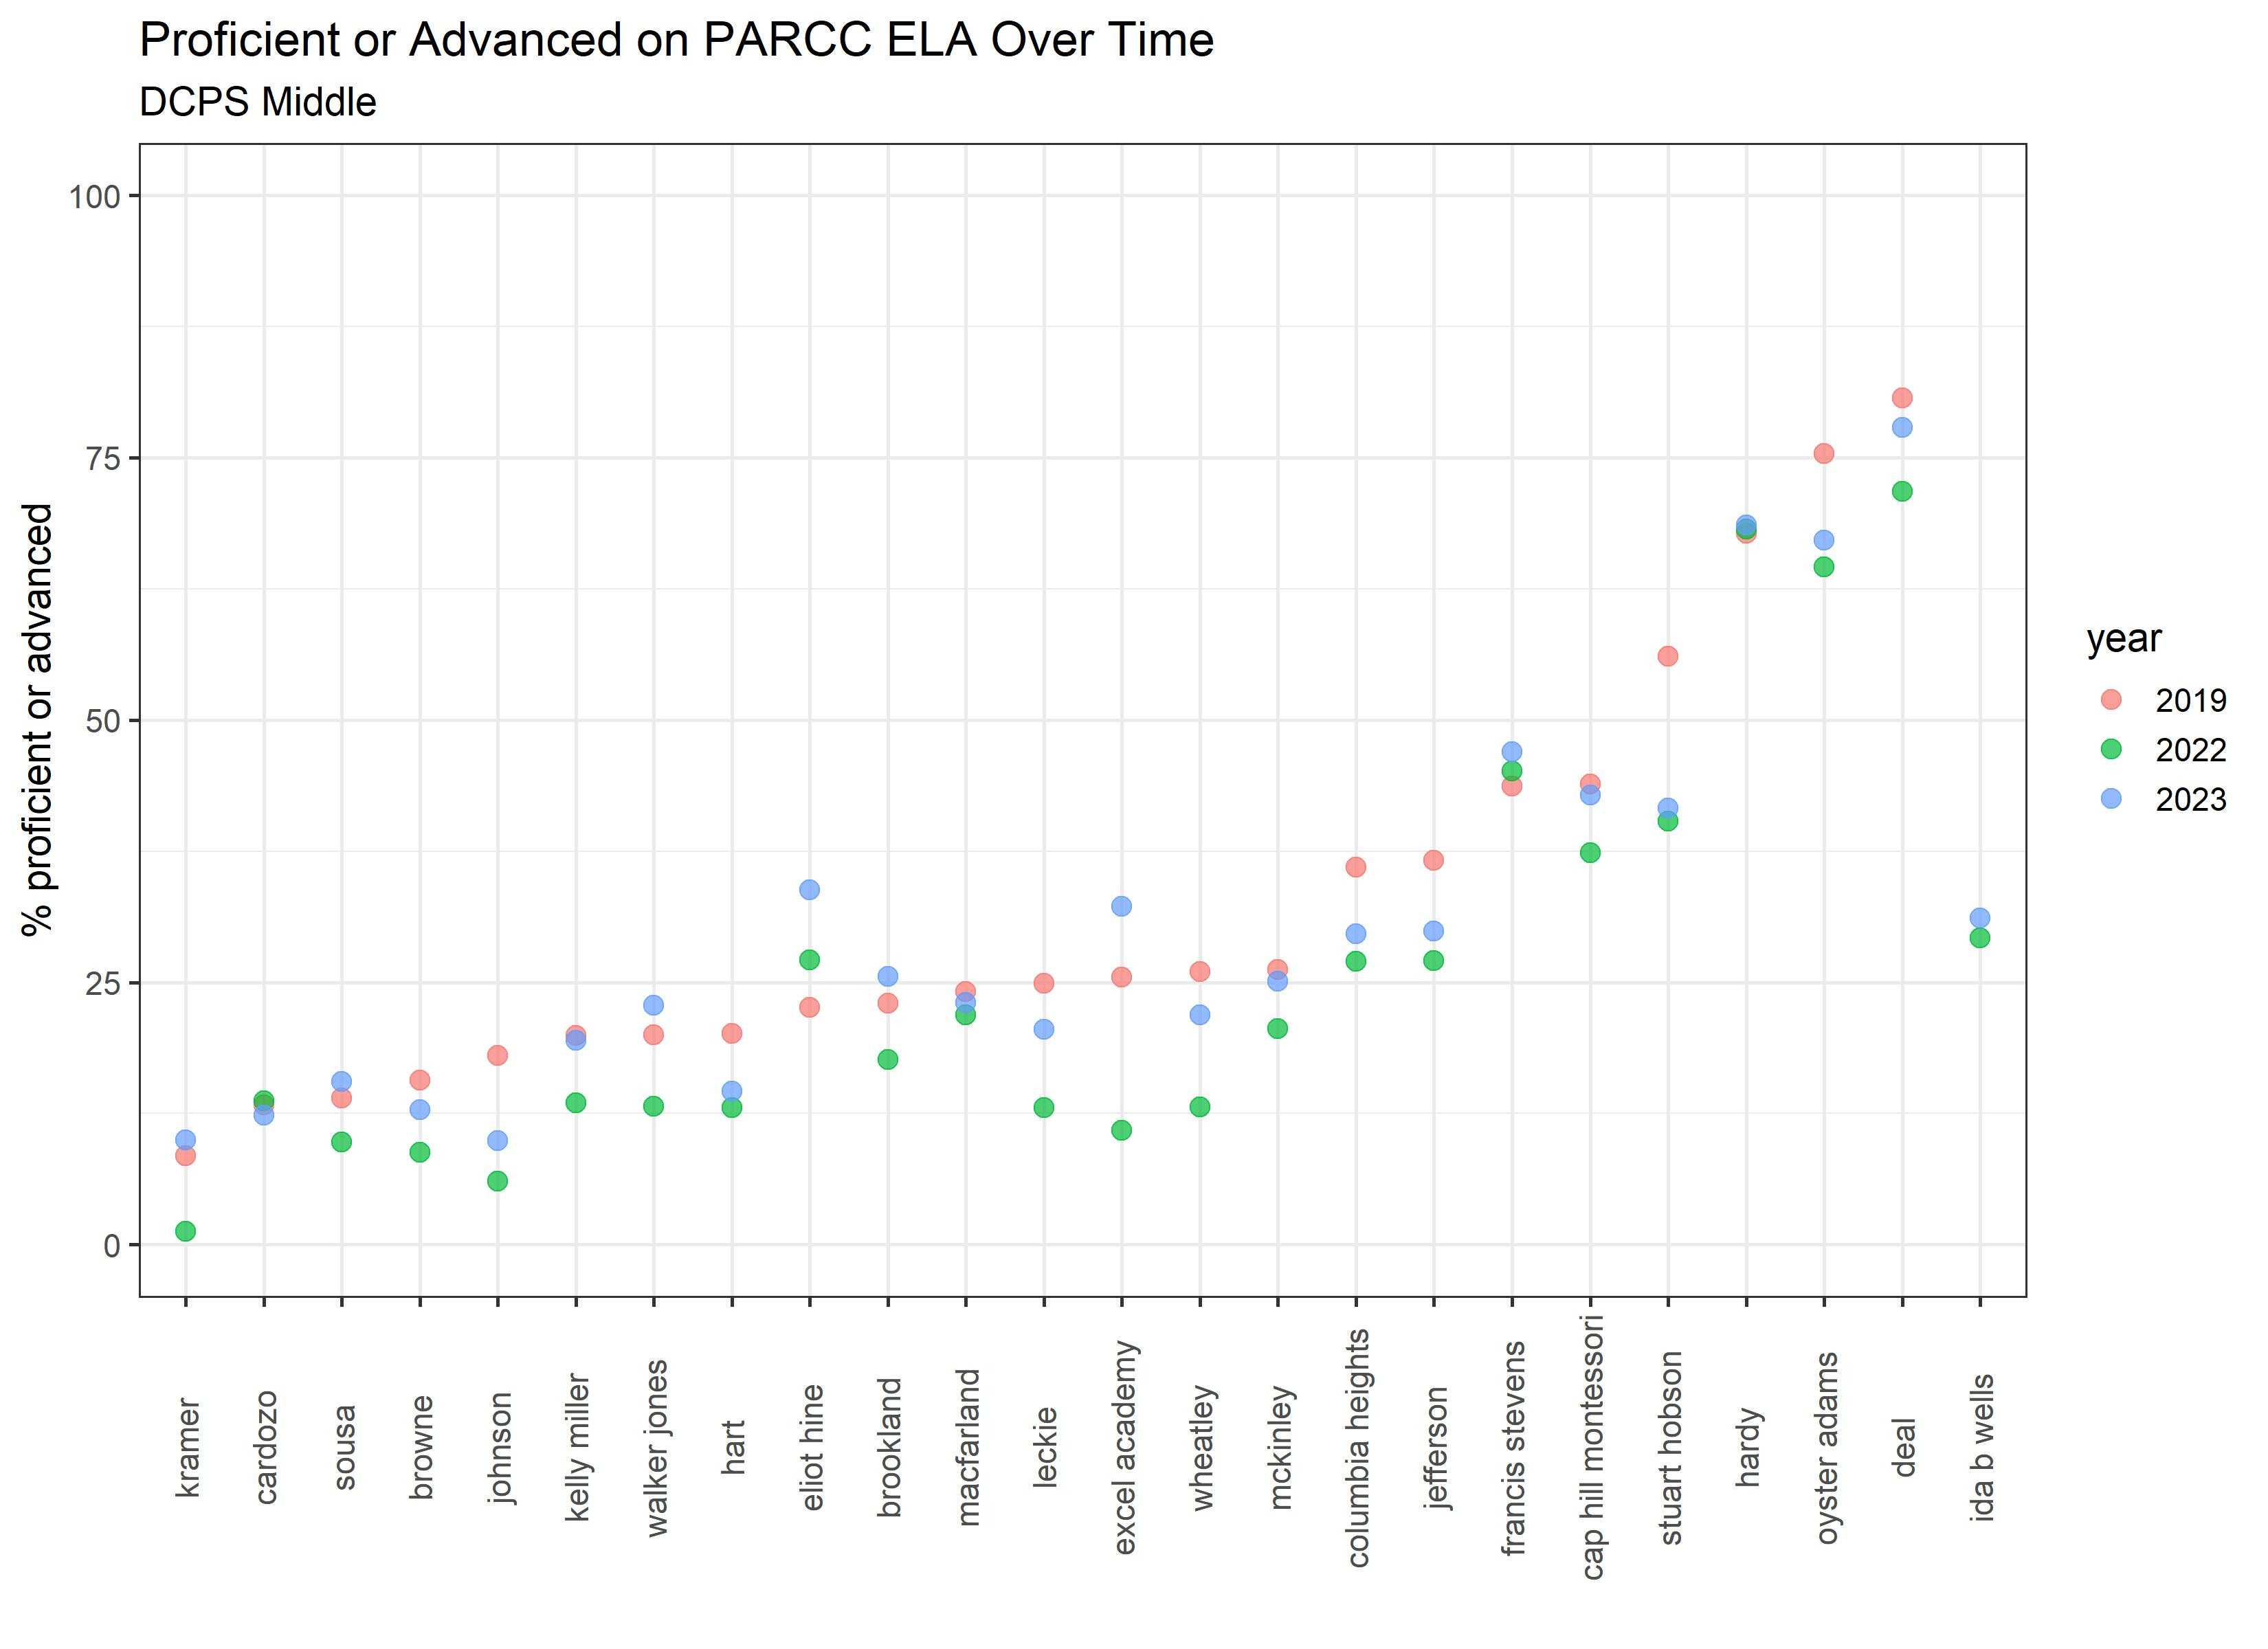
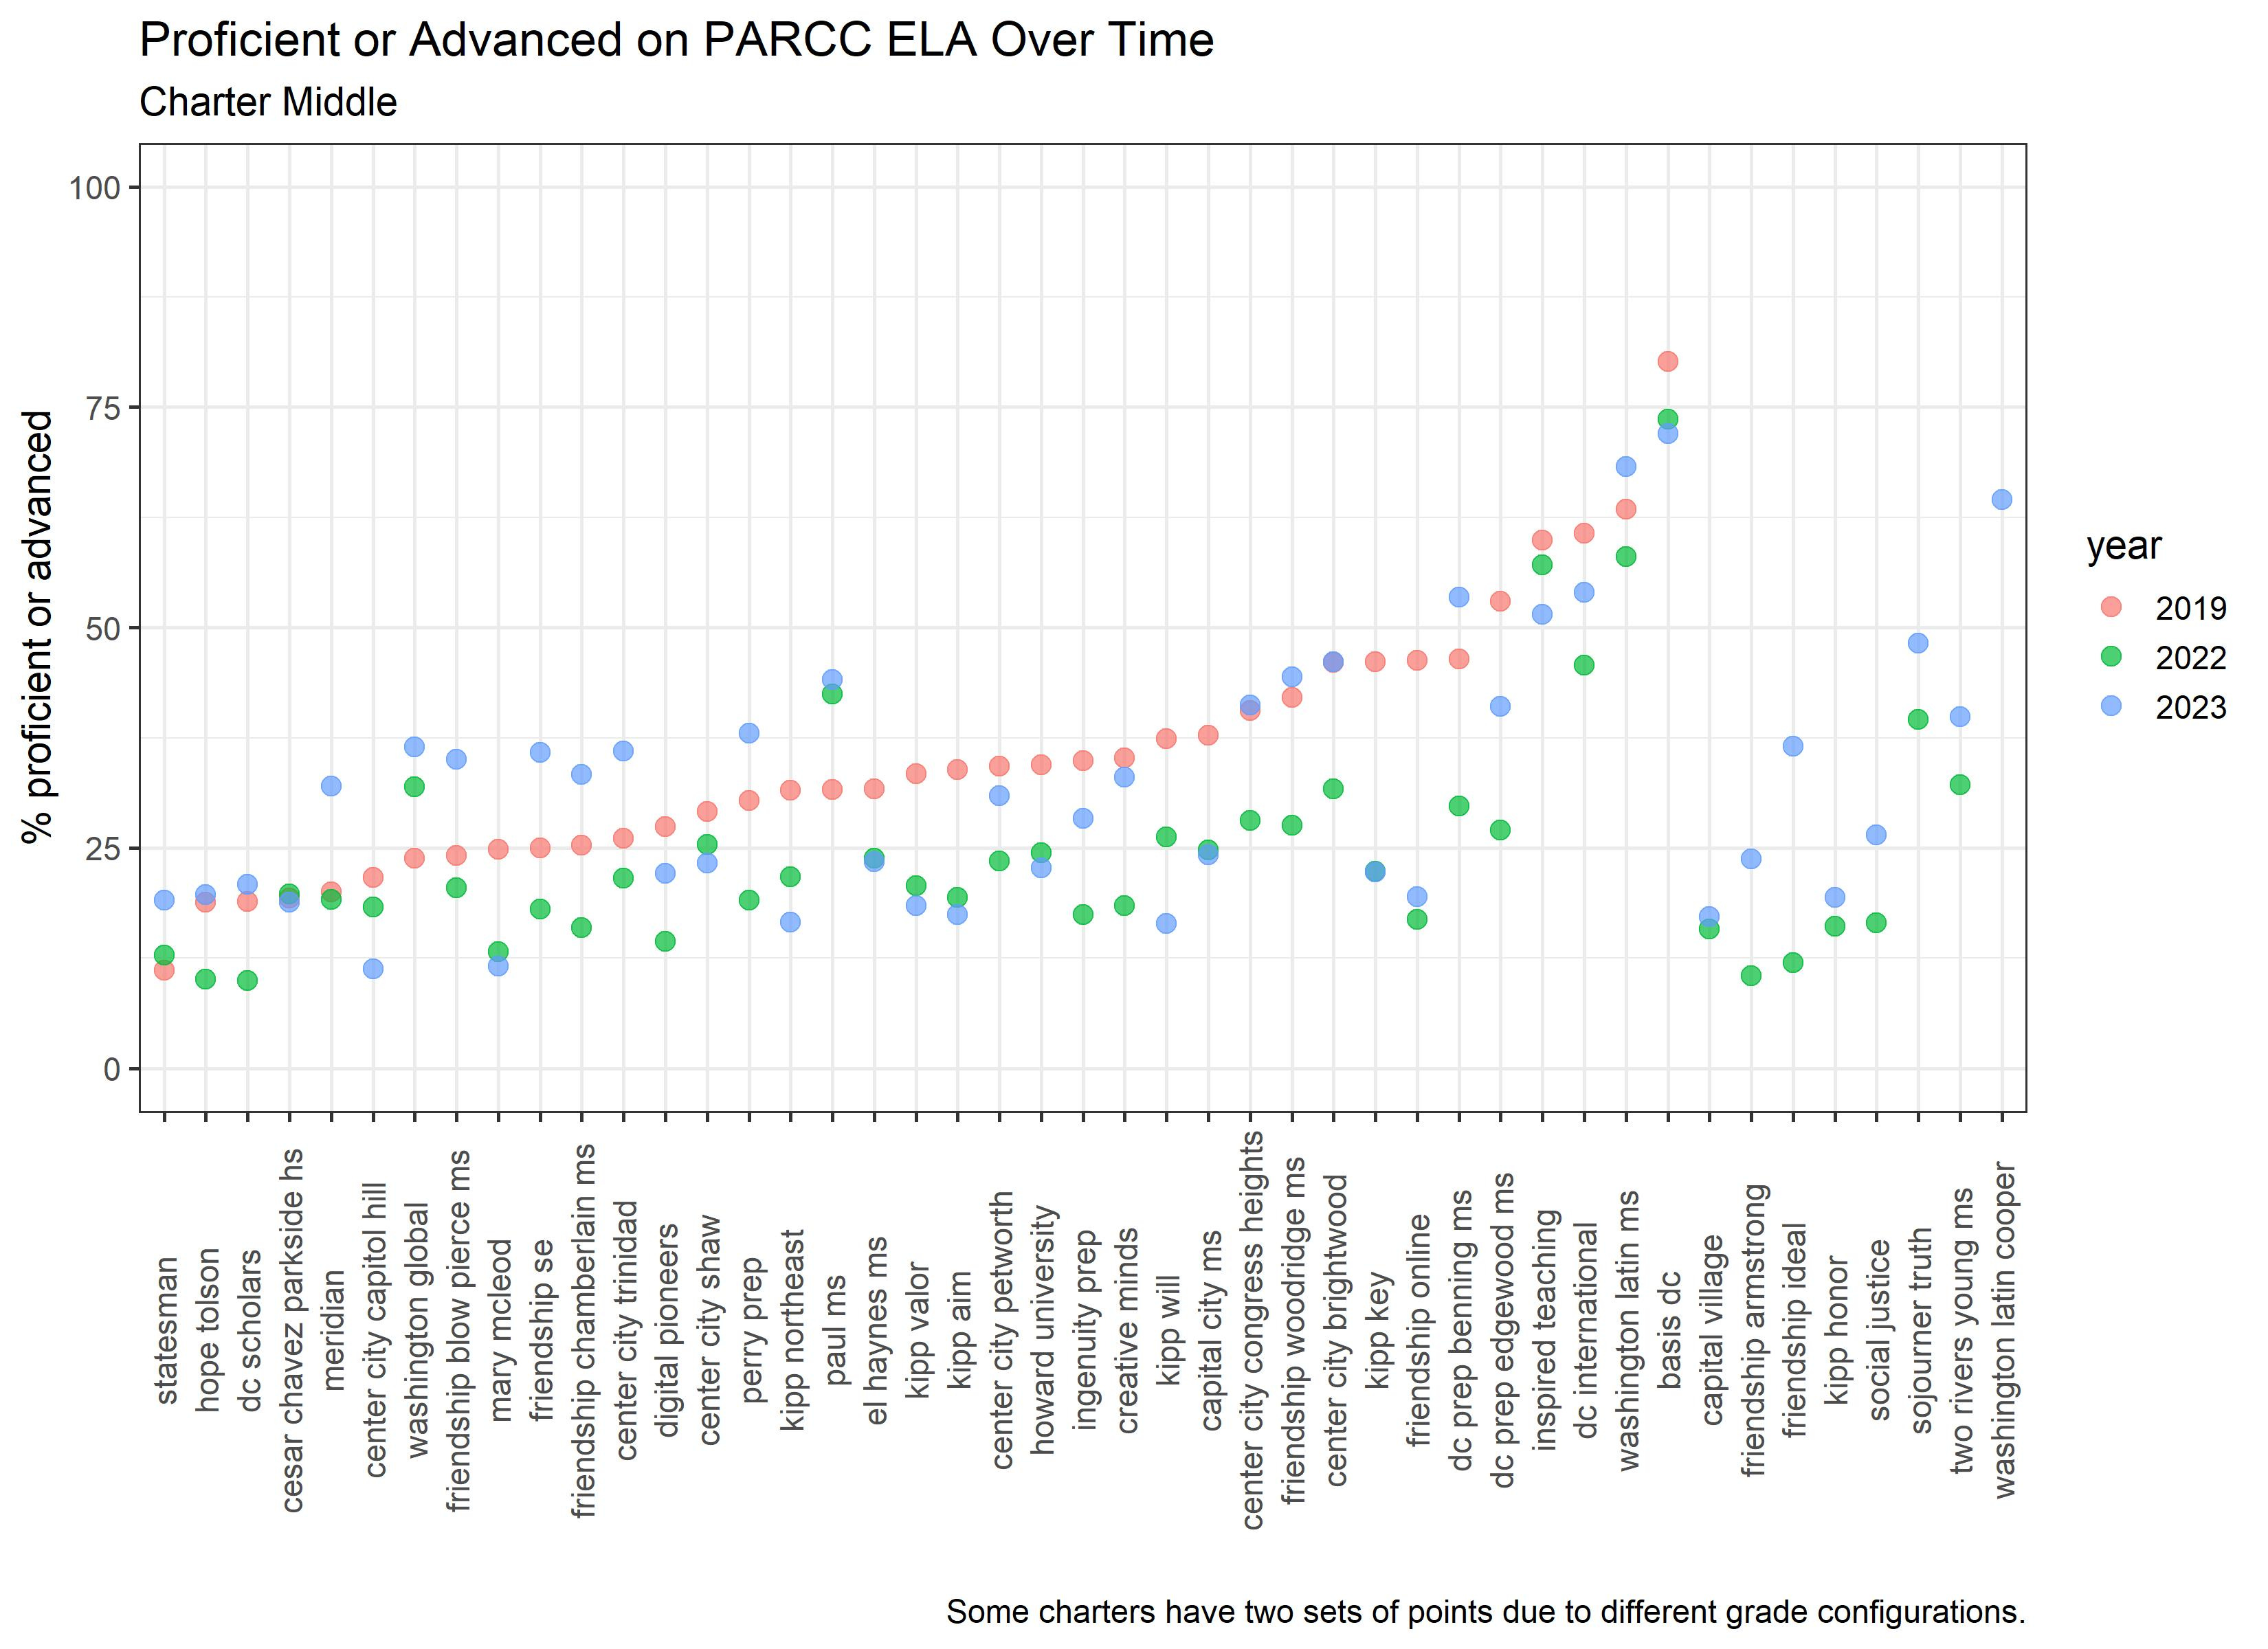
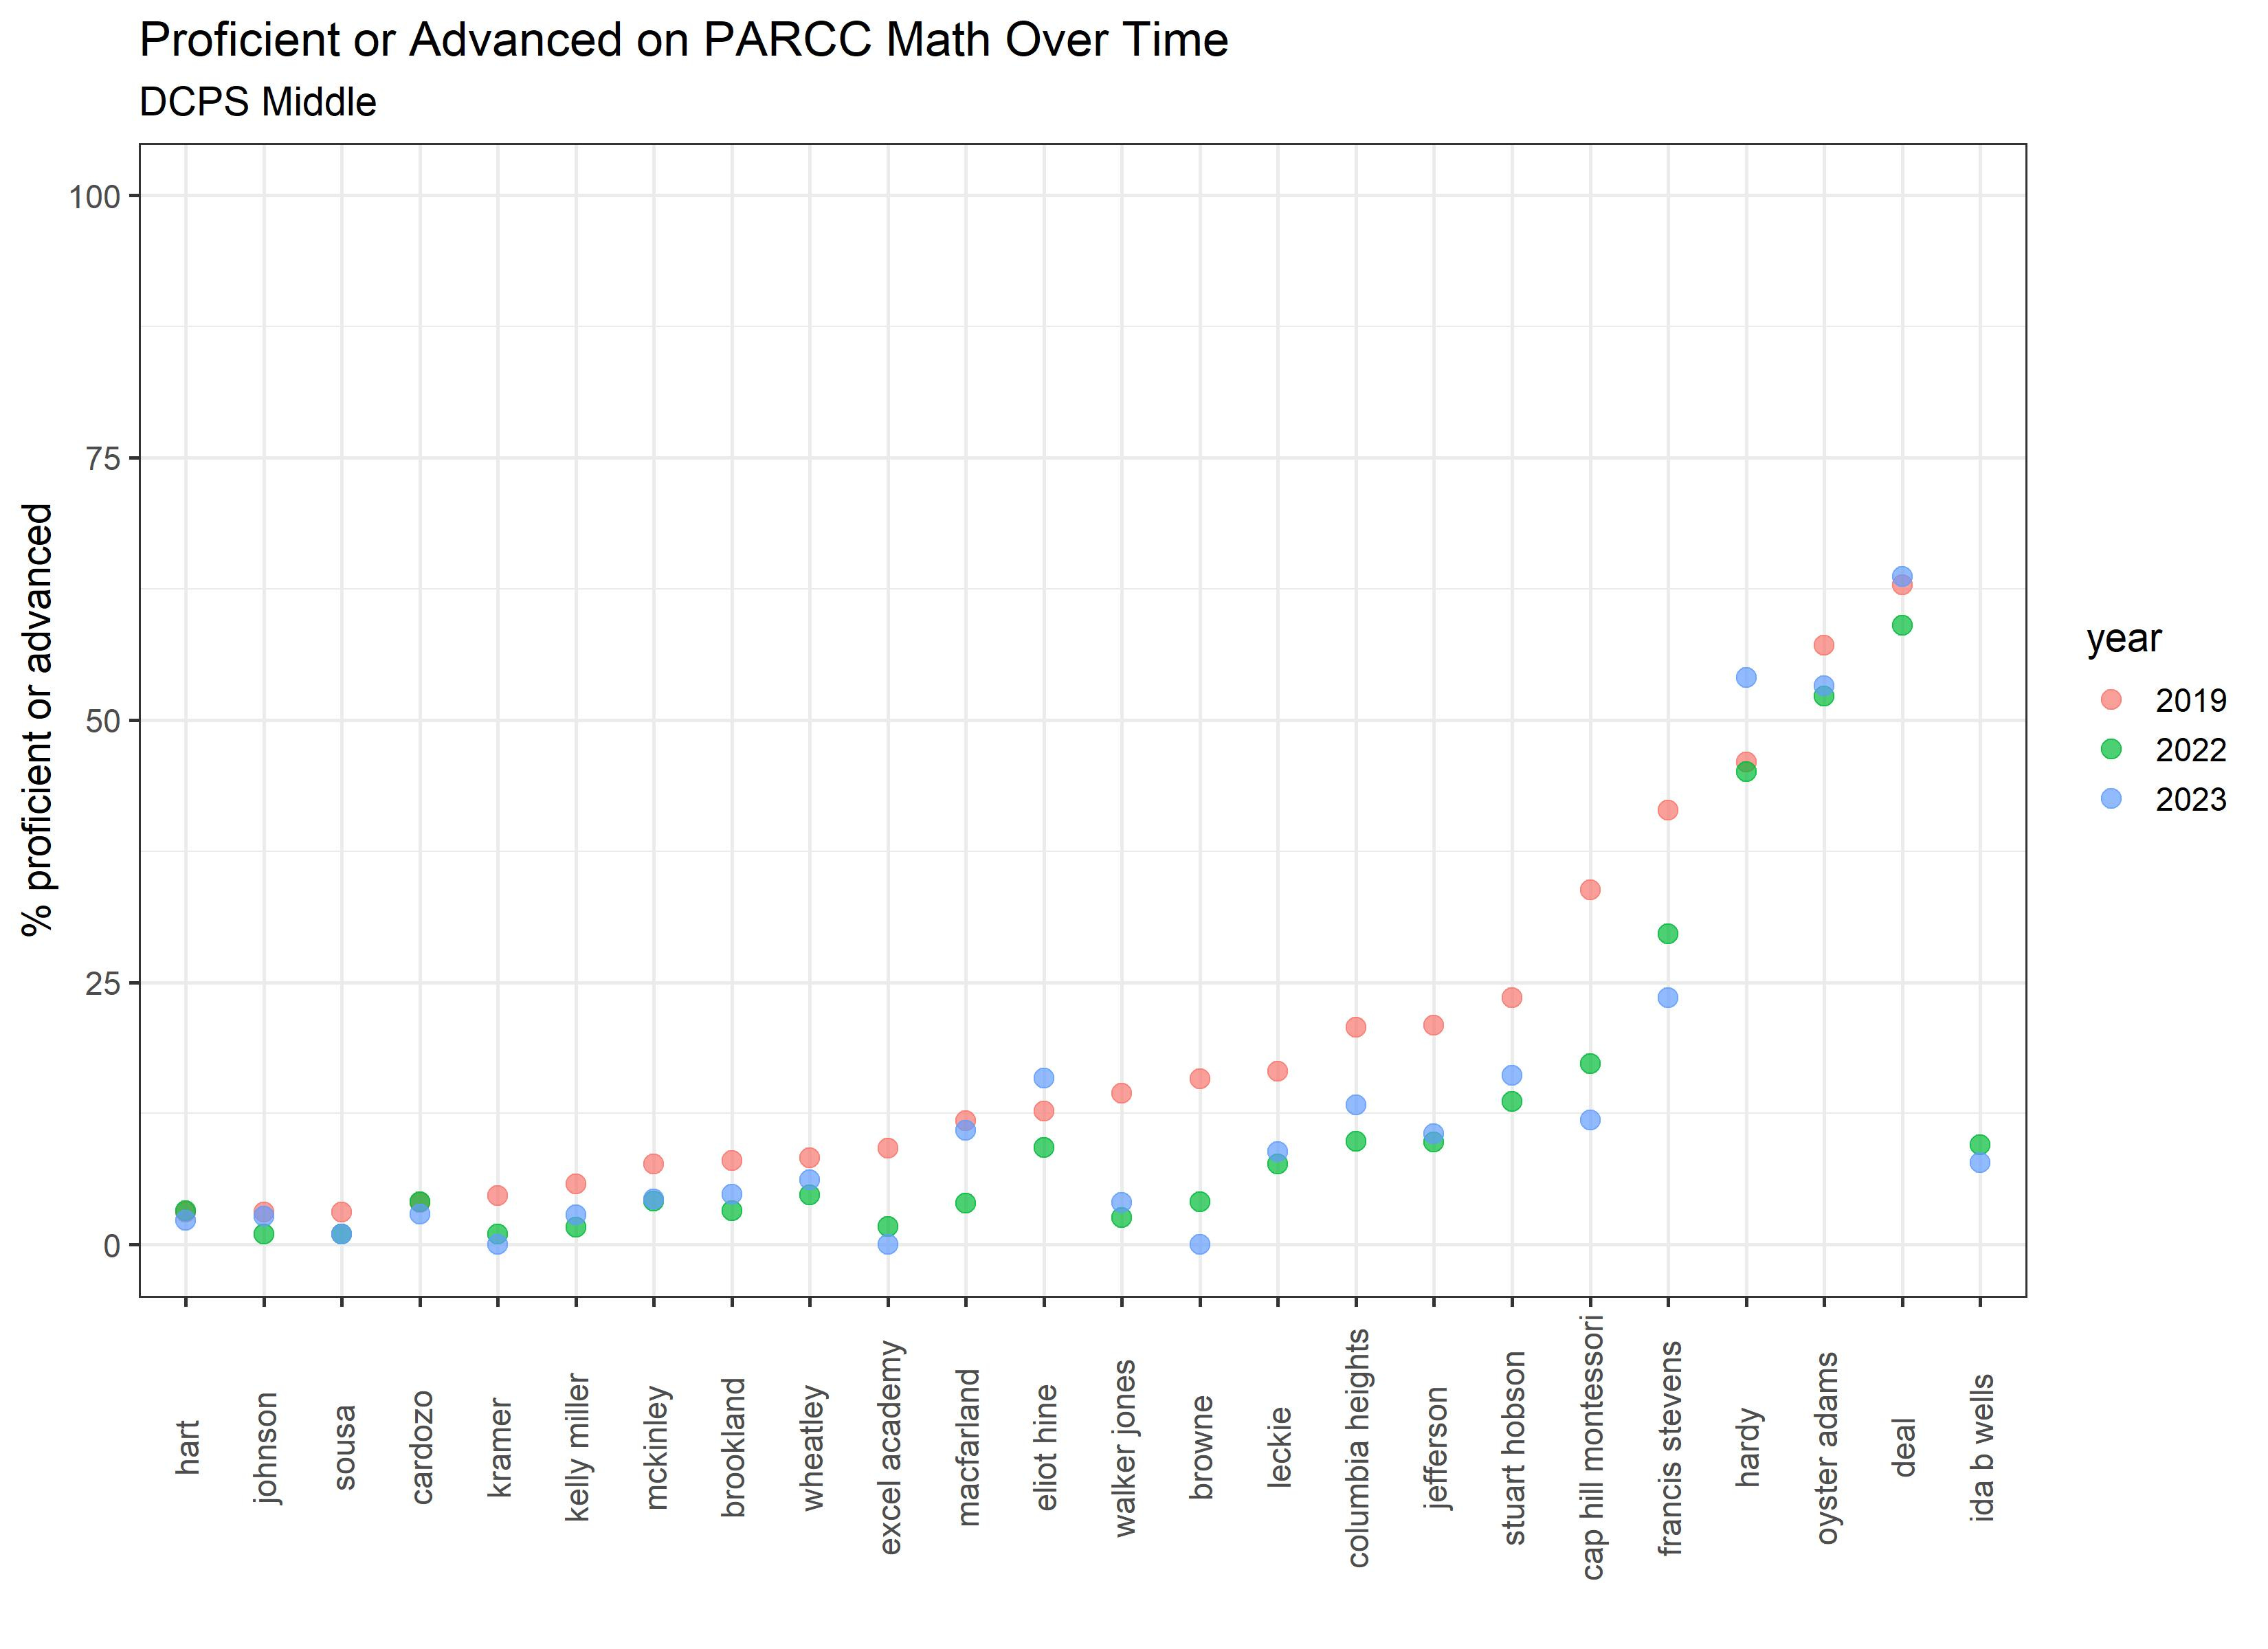
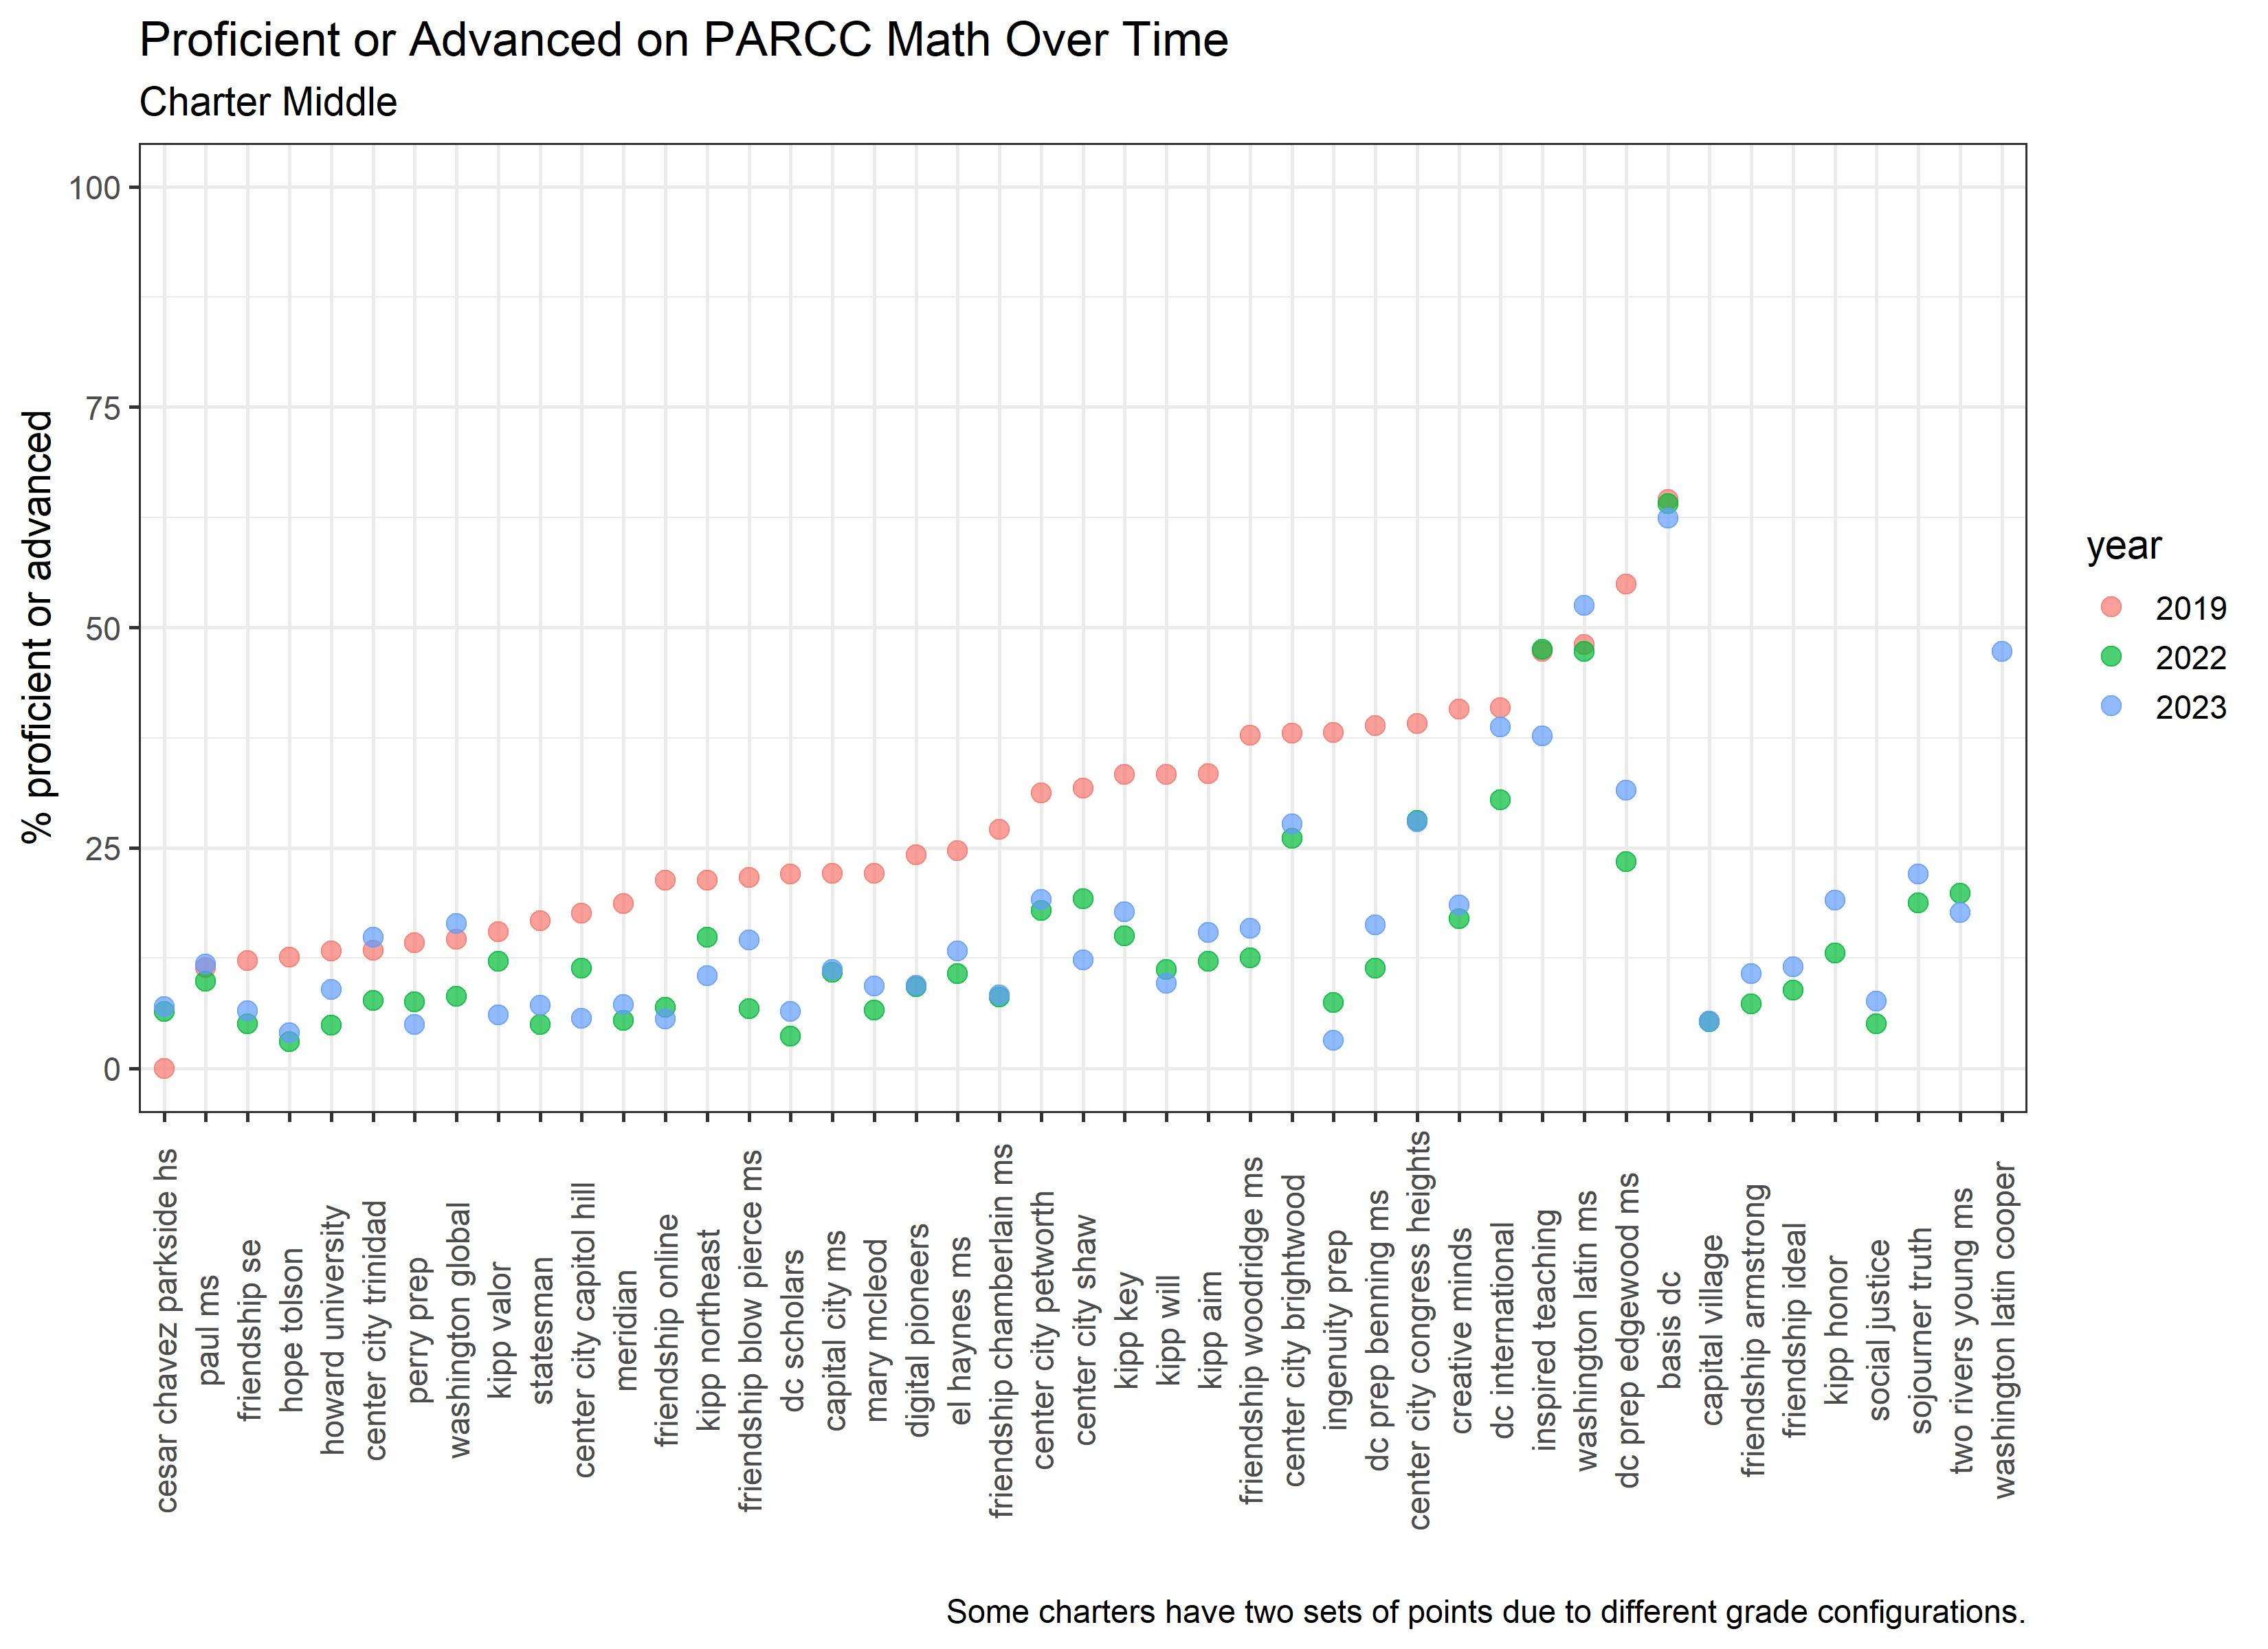
Finally, it should be noted (again) that the city’s proclamation that DC saw modest gains in terms of proficiency rates is really meaningless. I would want to know what were the annual learning gains before the pandemic, and what are they now? And what are the learning rate trajectories for students with different prior achievement levels? These questions can be answered, and researchers at the state education agency (OSSE) are smart enough to figure this out. But, given the authoritarian state of DC education with only one person in charge of all things education (DCPS, DC Public Charter School Board, and OSSE), we receive “good” and meaningless news. “Thanks to Mayor Bowser!”
HIGH SCHOOLS: